Contact

David-Kerrigan.com

Contact
Figure 1-Virus Discovery.png
Figure 2 - Virus Scale.png
Figure 3 - Virus Morphologies.jpg
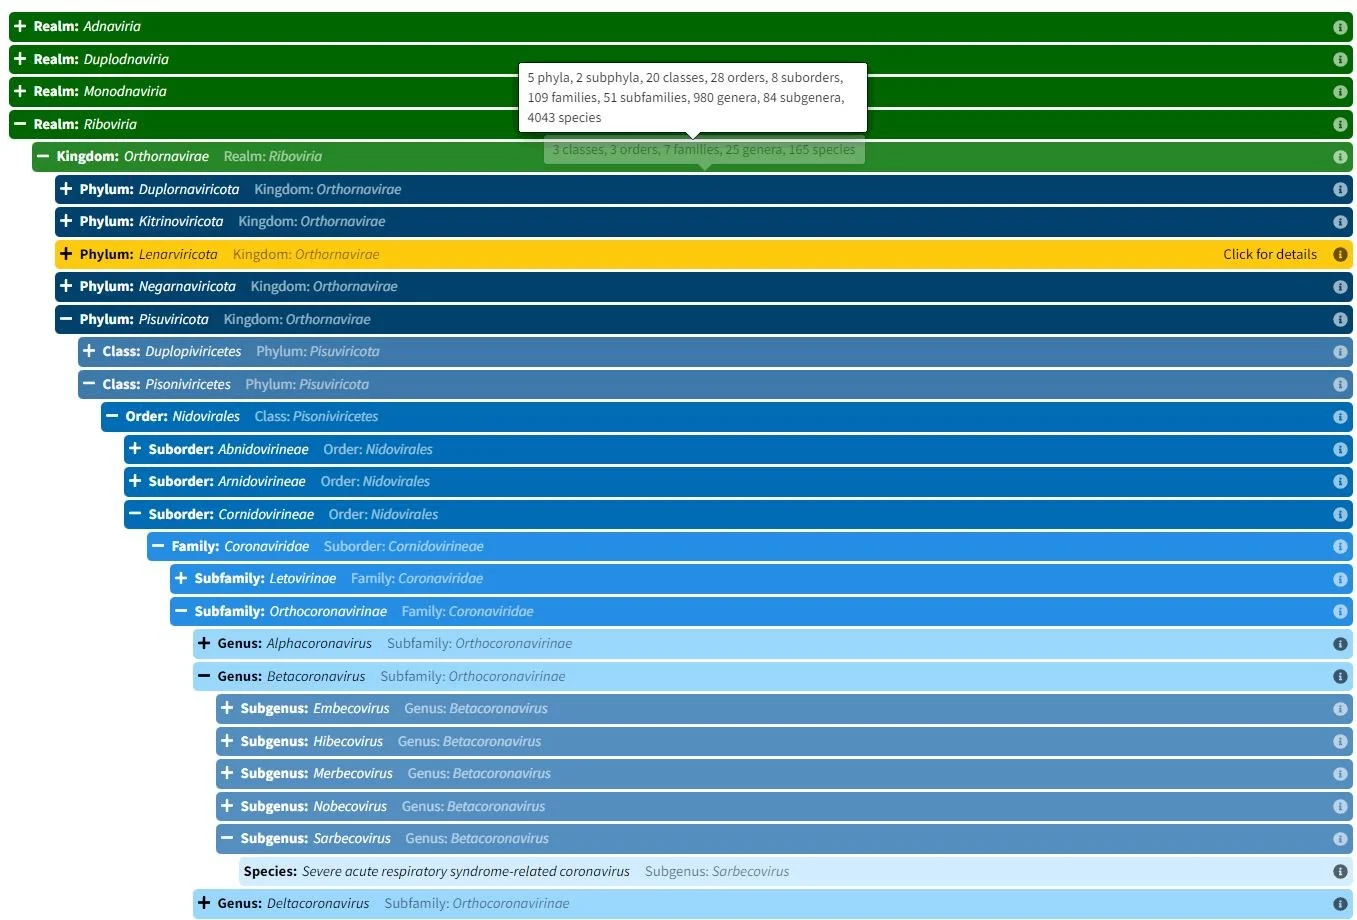
Figure 5 - SARS Taxonomy.JPG
Figure 6 - HCV.png
Figure 7 - A and B CoV.png
Figure 8 - SARS-CoV-2 Structure.png
Figure 9a - SARS-COV-2.png
Figure 9b - Influenza.png
Figure 10 - Main Viral Infections.png
Figure 11 - RADx.png
Figure 12 - Daily Testing.png
Figure 13 - US Testing Monthly.png
Figure 14 - UK Daily Testing.png
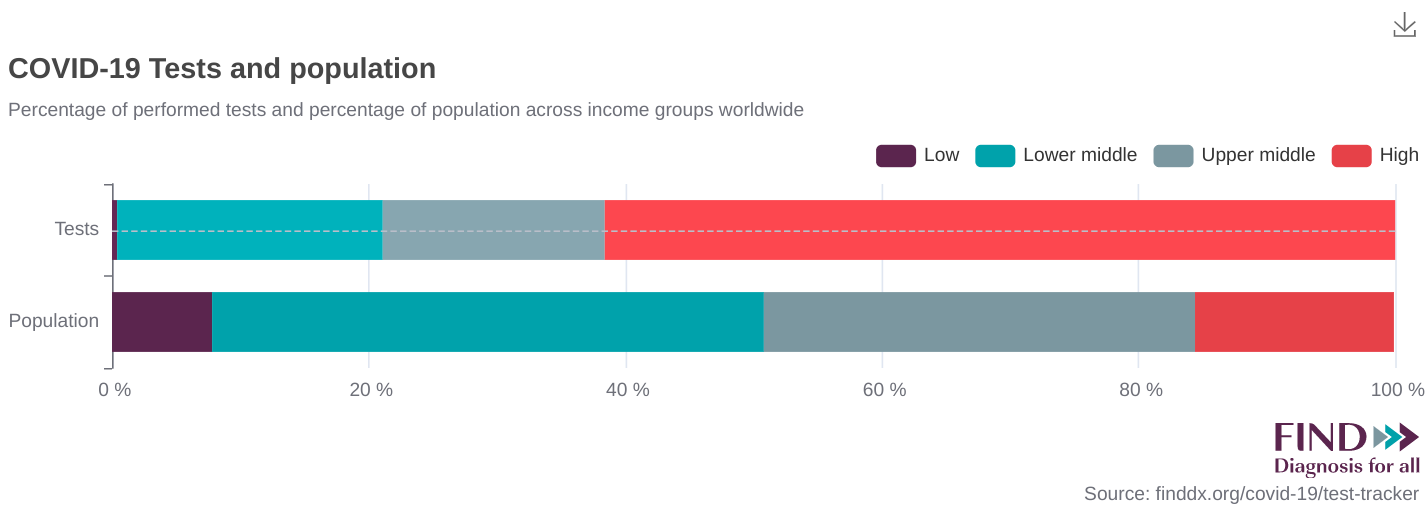
Figure 15 - Disparities by Income.png
Figure 16 - Testing Tradeoffs.png
Figure 17 - FDA EUA Flowchart.png
Figure 18 - Nasal Collection Sites.png
Figure 19 - Oropharyngeal Swab.png
Figure 20 - RADx Sample Types.png
Figure 21 - Public Interpretation of Results.png
Figure 22 - Swabbing Machine.png
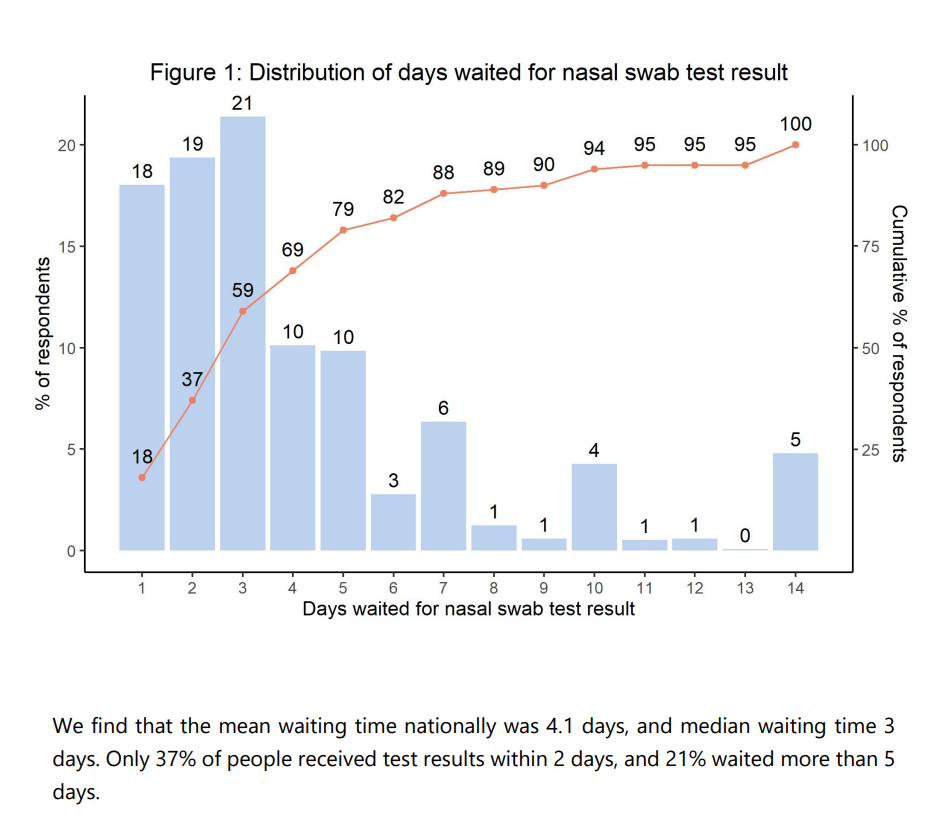
Figure 23 - TTR in the US in 2020.png
Figure 24 - Self Collection Swab Examples.png
Figure 25 - Aire and Lumen.png
Figure 26 - SpiroNose.jpg
Figure 27 - Google Trends PCR.png
Figure 28 - RT-PCR Ingredients.png
Figure 29 - PCR Result.png
Figure 30 - PCR CT Rules.png
Figure 31 - PCR Target Analysis.png
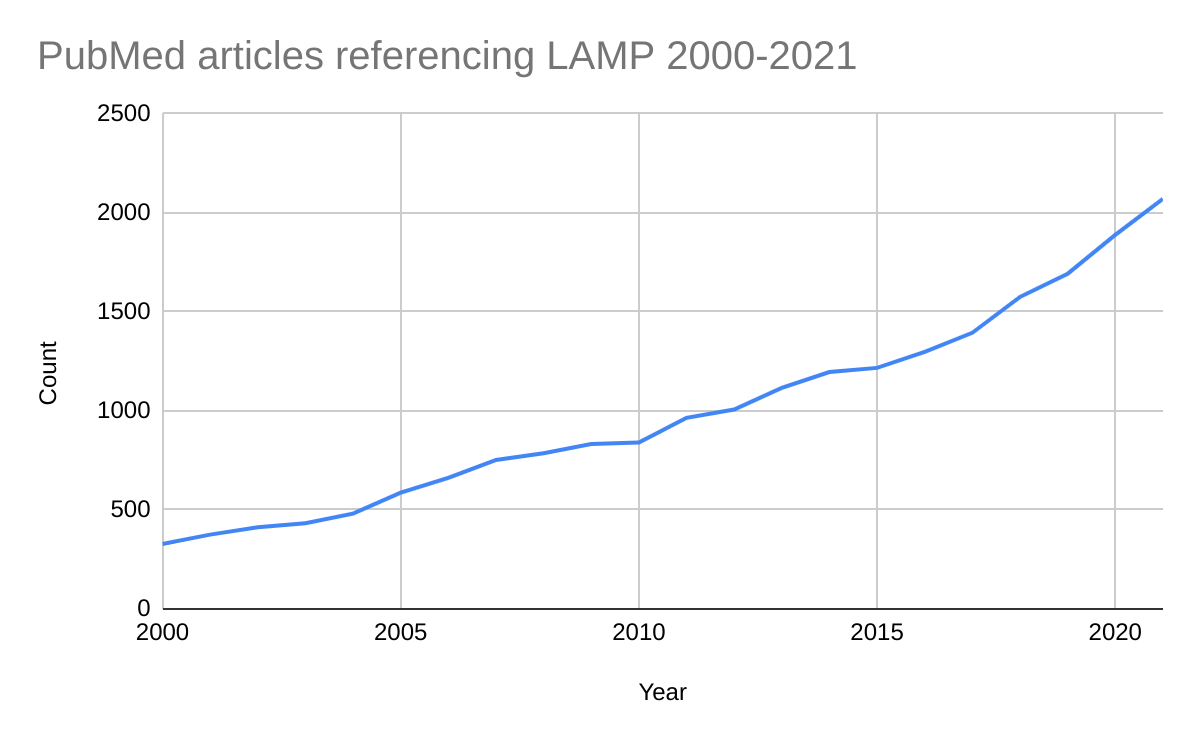
Figure 32 - LAMP in PubMed.png
Figure 33 - Trends for LFT.png
Figure 34 - LFT Construction.png
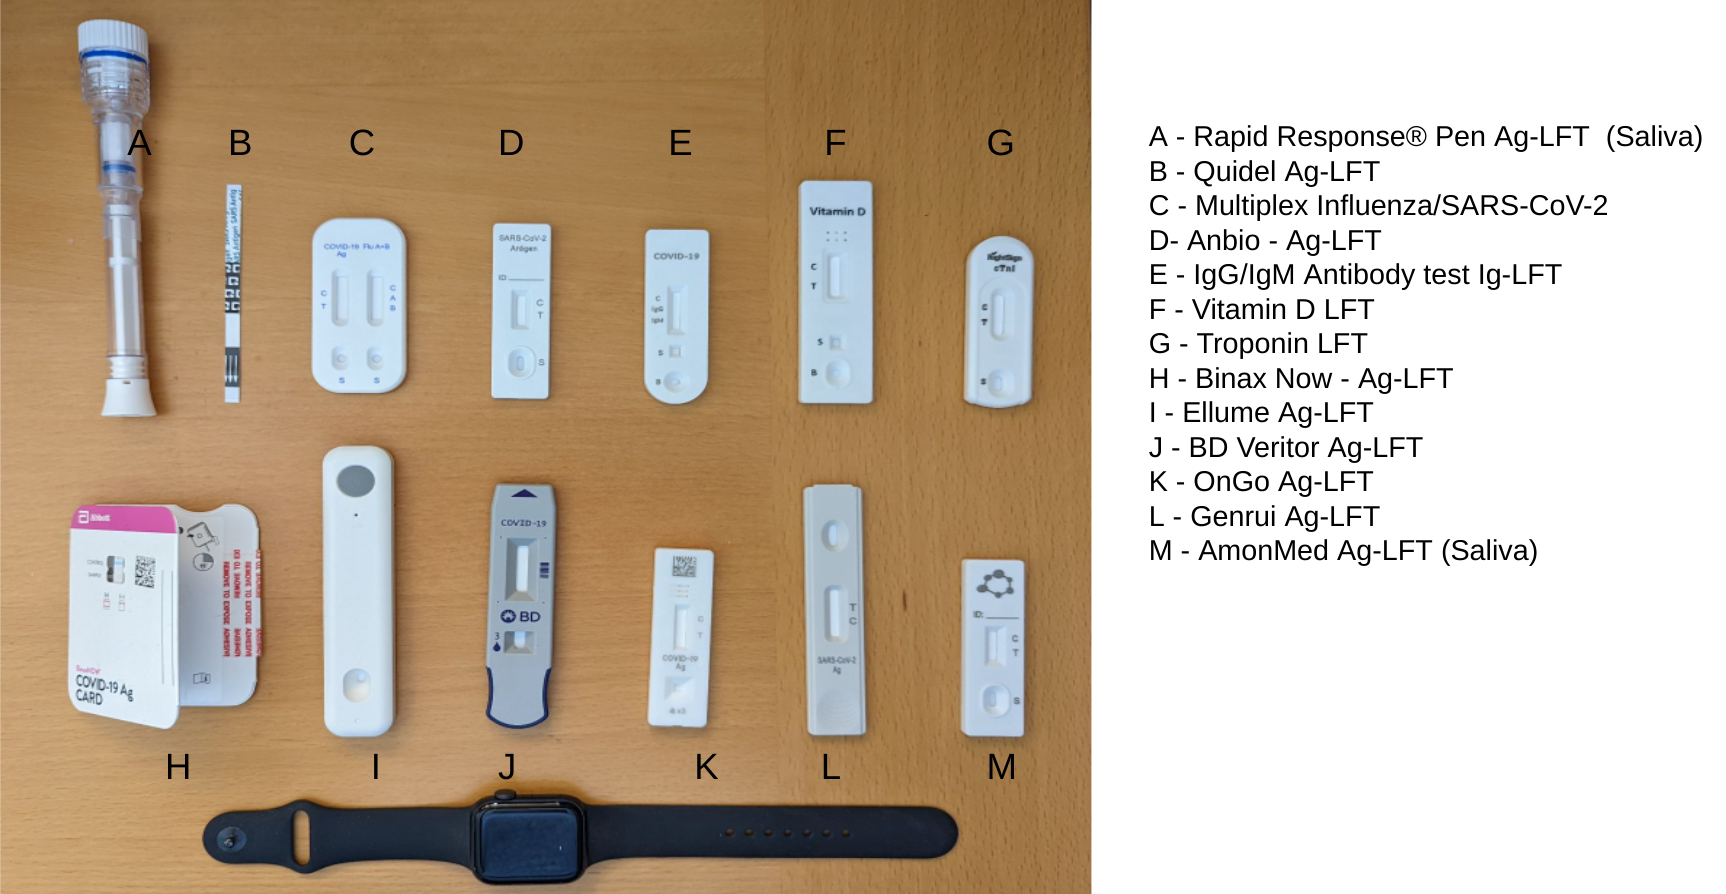
Figure 35 - LFT Examples.png
Figure 36 - BD Veritor LFT Reader.png
Figure 37 - Antibodies and Epitopes.png
Figure 38 - EUAs for Antibody tests.png
Figure 39 - S and N Antigens for Antibody Tests.png
Figure 40 - Antibodies and Vaccination Status.png
Figure 41 - Typical timing across antibody types.png
Figure 42 - Types of Antibody Tests.png
Figure 43 - ROC curve for serum and urine ELISA.png
Figure 44 - IBTS Antibodies.png
Figure 45 - Adaptive Immunity.png
Figure 46 - InVitro Diagnostics Market.png
Figure 47a - Abbott POC NAAT.png
Figure 47b - Cephid POC NAAT.png
Figure 48 - Visby PCR.png
Figure 49 - Cue Device.png
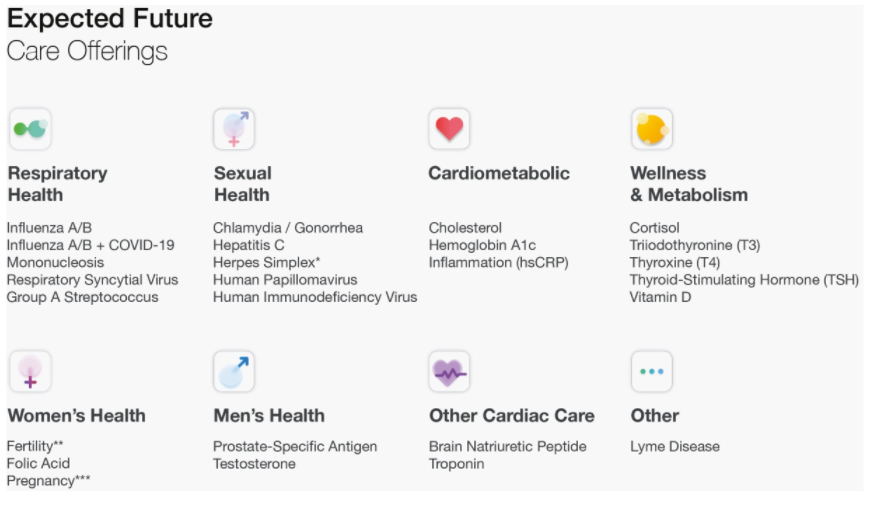
Figure 50 - Cue Test Menu.png
Figure 51 - Cue Development Roadmap.png
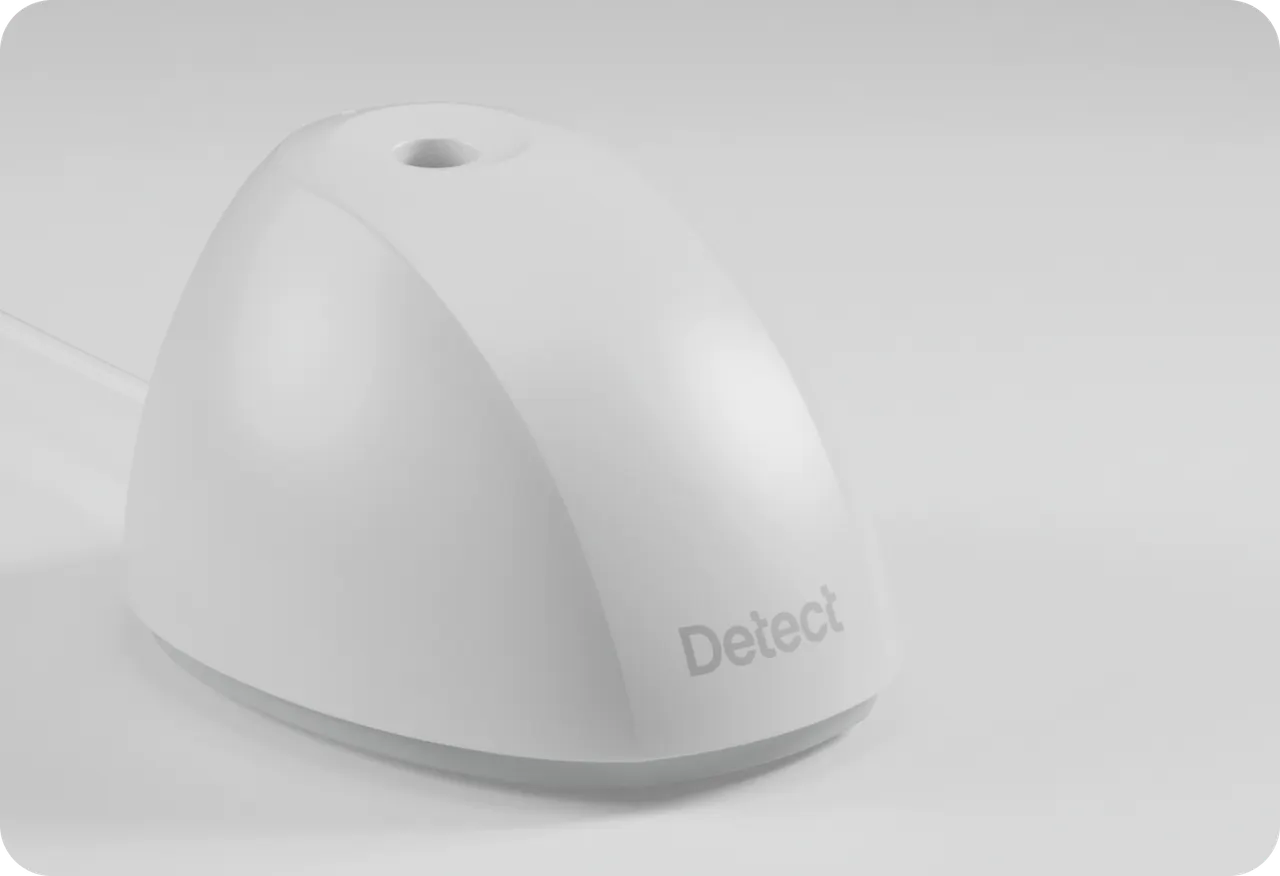
Figure 52 - Detect Device.png
Figure 53 - Circle HealthPod.png
Figure 54 - Lucira COVID-19 Kit.png
Figure 55 - Domestic NAATs.png
Figure 56 - Some Wearable Sensors.png
Figure 57 - Aktiia and SPo2.png
Figure 58 - RR Intervals.png
Figure 59 - Mindfield Respiration Sensor.png
Figure 60 - Whoop RPM.png
Figure 61 - Kinsa Temp Data.png
Figure 62 - Trackers Pre Symptom Onset.png
Figure 63 - Indicators After Vaccination.png
Figure 64 - HRV Study.png
Figure 65 - RHR indicators pre symptom onset.png
Figure 66 - HRV Changes pre symptom onset.png
Figure 67 - Yale Passive Clip.png
Figure 68 - VitalConnect Platform Dashboard.png
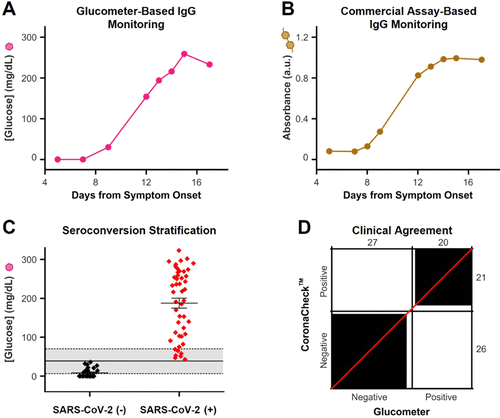
Figure 69 - Glucometer Repurposed vs Lab Test.png
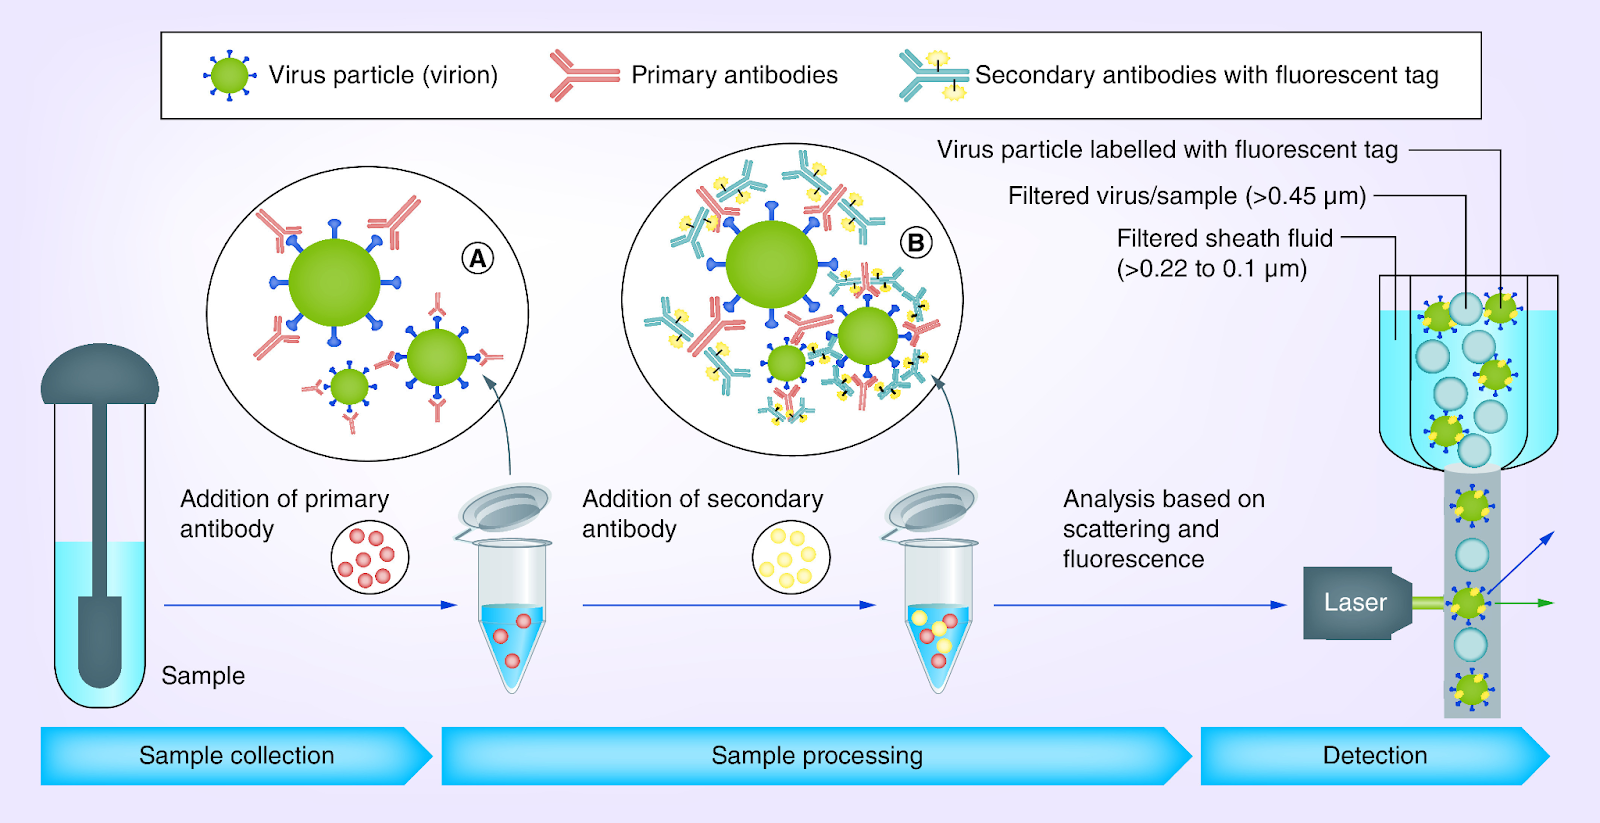
Figure 70 - An illustration of Flow Virometry workflow.png
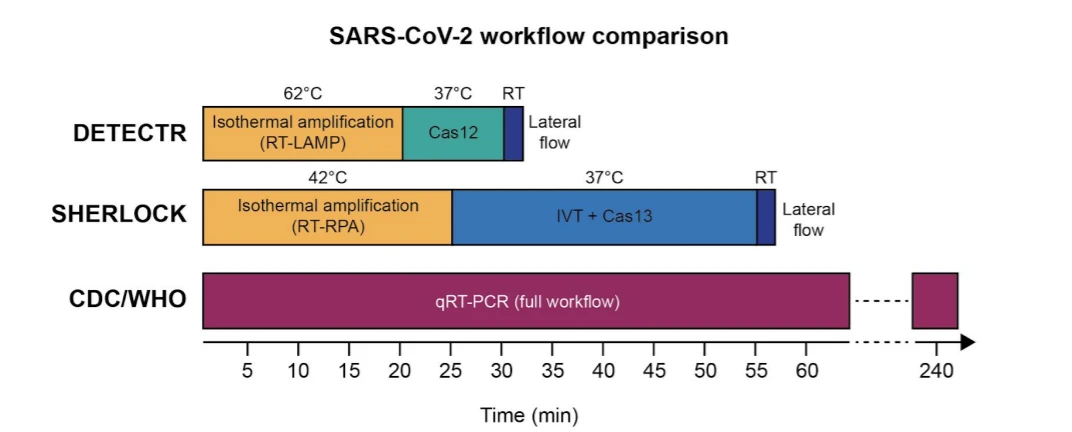
Figure 71 - CRISPR vs RTqPCR Workflows.png
Figure 73 - Categories of research using CRISPR for SARS-CoV-2.png
Figure 72 - Low cost CRISPR - $15 battery-powered device.png
Figure 74 - Sequencing Techniques.png
Figure 75 - Phylodynamics Example.png
Figure 76a - Illumina.png
Figure 76b - MinIon.png
Figure 77 - RAPID 1.0 with handheld device.png
Figure 78 - Aptamers on PubMed.png
Figure 79 - OLO CBC Device.png
Figure 80 - PubMed articles mentioning proteomics.png
Figure 81 - SARS-CoV-2 Mutations.png
Figure 82 - SARS-CoV-2 Phylogeny Tree.png
Figure 83 - NWSS Reporting Dashboard via CDC.png
Figure 84 - Microsoft Premonition Device.png
Figure 85 - CDC's CFA.png
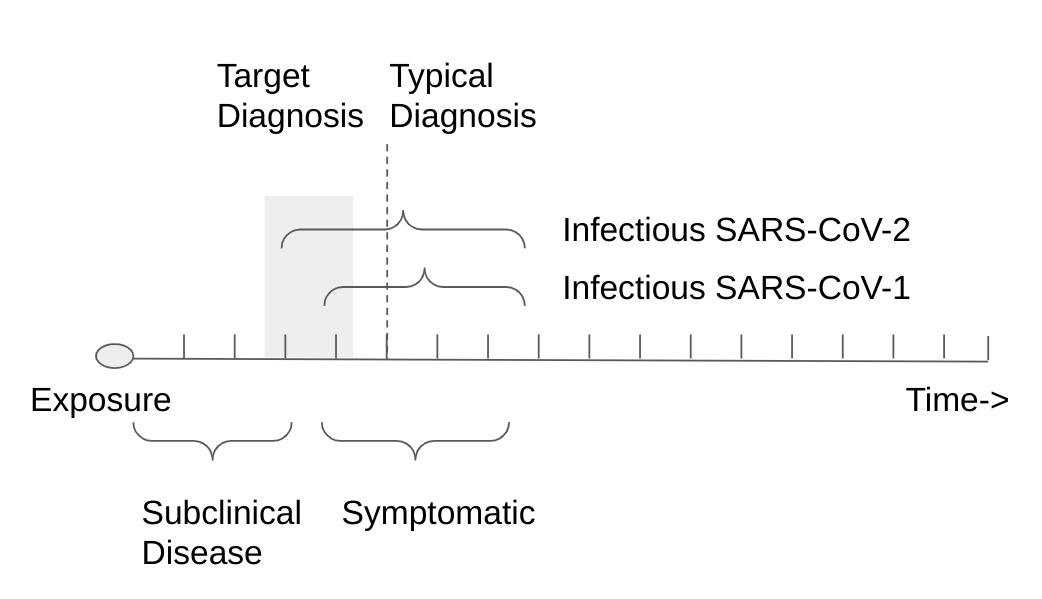
Figure 86 - Target Earlier Diagnostics.png
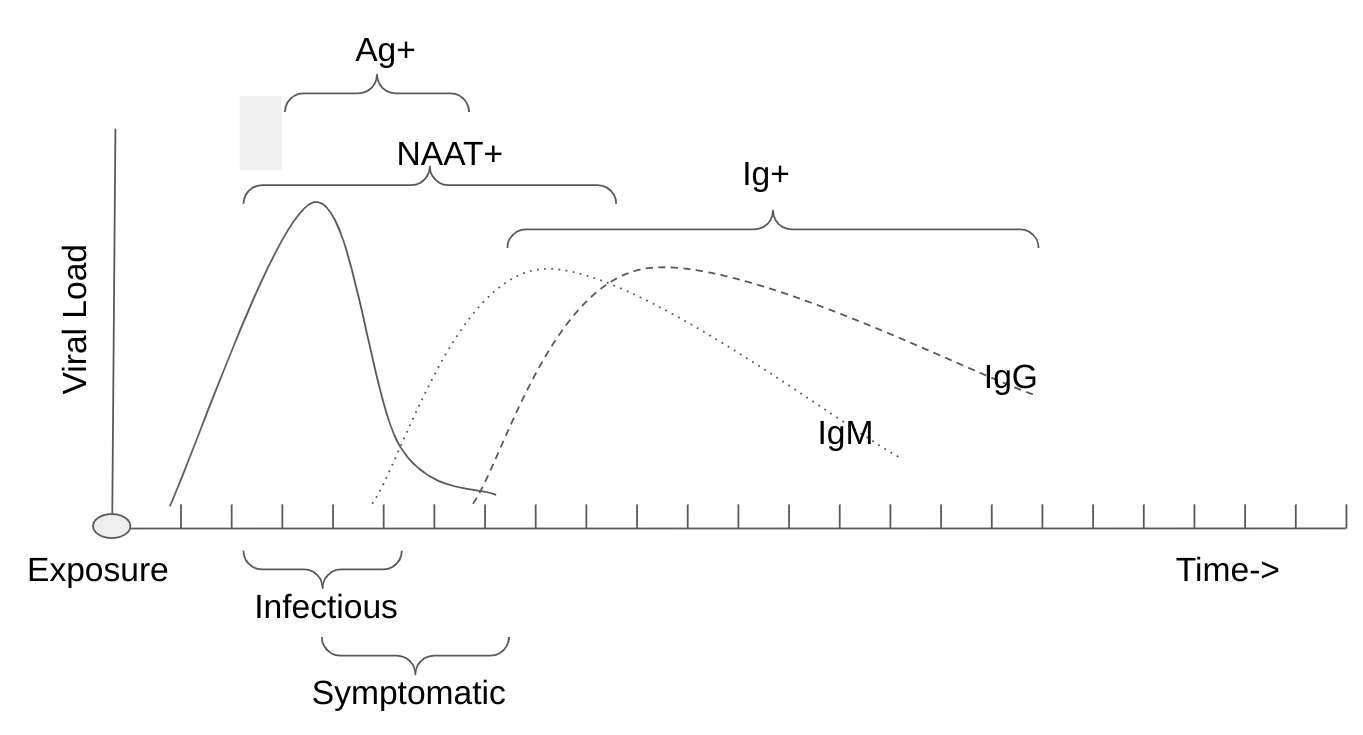
Figure 87 - Viral Load vs Test Positivity.png
Figure 88 - Diagnostics for Enteric Viruses.png
Figure 89a - Accula Device.png
Figure 89b - Talis One device.png
Figure 90 - LAMP for Diagnosis of Zika Virus.png
Figure 91 - US MPX Capacity.png
Figure 92 - MPX Tests.png
Figure 93 - ICTV Virus Taxa.png
Figure 94 - NP Swabbing.png
Figure 95 - SARS MERS Dividend.png
1 2 3 4 5 6 7 8 9 10 11 12 13 14 15 16 17 18 19 20 21 22 23 24 25 26 27 28 29 30 31 32 33 34 35 36 37 38 39 40 41 42 43 44 45 46 47 48 49 50 51 52 53 54 55 56 57 58 59 60 61 62 63 64 65 66 67 68 69 70 71 72 73 74 75 76 77 78 79 80 81 82 83 84 85 86 87 88 89 90 91 92 93 94 95 96 97 98
Previous Next
Figure 1-Virus Discovery.png
Figure 2 - Virus Scale.png
Figure 3 - Virus Morphologies.jpg
Figure 5 - SARS Taxonomy.JPG
Figure 6 - HCV.png
Figure 7 - A and B CoV.png
Figure 8 - SARS-CoV-2 Structure.png
Figure 9a - SARS-COV-2.png
Figure 9b - Influenza.png
Figure 10 - Main Viral Infections.png
Figure 11 - RADx.png
Figure 12 - Daily Testing.png
Figure 13 - US Testing Monthly.png
Figure 14 - UK Daily Testing.png
Figure 15 - Disparities by Income.png
Figure 16 - Testing Tradeoffs.png
Figure 17 - FDA EUA Flowchart.png
Figure 18 - Nasal Collection Sites.png
Figure 19 - Oropharyngeal Swab.png
Figure 20 - RADx Sample Types.png
Figure 21 - Public Interpretation of Results.png
Figure 22 - Swabbing Machine.png
Figure 23 - TTR in the US in 2020.png
Figure 24 - Self Collection Swab Examples.png
Figure 25 - Aire and Lumen.png
Figure 26 - SpiroNose.jpg
Figure 27 - Google Trends PCR.png
Figure 28 - RT-PCR Ingredients.png
Figure 29 - PCR Result.png
Figure 30 - PCR CT Rules.png
Figure 31 - PCR Target Analysis.png
Figure 32 - LAMP in PubMed.png
Figure 33 - Trends for LFT.png
Figure 34 - LFT Construction.png
Figure 35 - LFT Examples.png
Figure 36 - BD Veritor LFT Reader.png
Figure 37 - Antibodies and Epitopes.png
Figure 38 - EUAs for Antibody tests.png
Figure 39 - S and N Antigens for Antibody Tests.png
Figure 40 - Antibodies and Vaccination Status.png
Figure 41 - Typical timing across antibody types.png
Figure 42 - Types of Antibody Tests.png
Figure 43 - ROC curve for serum and urine ELISA.png
Figure 44 - IBTS Antibodies.png
Figure 45 - Adaptive Immunity.png
Figure 46 - InVitro Diagnostics Market.png
Figure 47a - Abbott POC NAAT.png
Figure 47b - Cephid POC NAAT.png
Figure 48 - Visby PCR.png
Figure 49 - Cue Device.png
Figure 50 - Cue Test Menu.png
Figure 51 - Cue Development Roadmap.png
Figure 52 - Detect Device.png
Figure 53 - Circle HealthPod.png
Figure 54 - Lucira COVID-19 Kit.png
Figure 55 - Domestic NAATs.png
Figure 56 - Some Wearable Sensors.png
Figure 57 - Aktiia and SPo2.png
Figure 58 - RR Intervals.png
Figure 59 - Mindfield Respiration Sensor.png
Figure 60 - Whoop RPM.png
Figure 61 - Kinsa Temp Data.png
Figure 62 - Trackers Pre Symptom Onset.png
Figure 63 - Indicators After Vaccination.png
Figure 64 - HRV Study.png
Figure 65 - RHR indicators pre symptom onset.png
Figure 66 - HRV Changes pre symptom onset.png
Figure 67 - Yale Passive Clip.png
Figure 68 - VitalConnect Platform Dashboard.png
Figure 69 - Glucometer Repurposed vs Lab Test.png
Figure 70 - An illustration of Flow Virometry workflow.png
Figure 71 - CRISPR vs RTqPCR Workflows.png
Figure 73 - Categories of research using CRISPR for SARS-CoV-2.png
Figure 72 - Low cost CRISPR - $15 battery-powered device.png
Figure 74 - Sequencing Techniques.png
Figure 75 - Phylodynamics Example.png
Figure 76a - Illumina.png
Figure 76b - MinIon.png
Figure 77 - RAPID 1.0 with handheld device.png
Figure 78 - Aptamers on PubMed.png
Figure 79 - OLO CBC Device.png
Figure 80 - PubMed articles mentioning proteomics.png
Figure 81 - SARS-CoV-2 Mutations.png
Figure 82 - SARS-CoV-2 Phylogeny Tree.png
Figure 83 - NWSS Reporting Dashboard via CDC.png
Figure 84 - Microsoft Premonition Device.png
Figure 85 - CDC's CFA.png
Figure 86 - Target Earlier Diagnostics.png
Figure 87 - Viral Load vs Test Positivity.png
Figure 88 - Diagnostics for Enteric Viruses.png
Figure 89a - Accula Device.png
Figure 89b - Talis One device.png
Figure 90 - LAMP for Diagnosis of Zika Virus.png
Figure 91 - US MPX Capacity.png
Figure 92 - MPX Tests.png
Figure 93 - ICTV Virus Taxa.png
Figure 94 - NP Swabbing.png
Figure 95 - SARS MERS Dividend.png

David Kerrigan Author Page on Amazon

Back to Top

Copyright David Kerrigan 2015-2025