Chapter 1 - Page 14
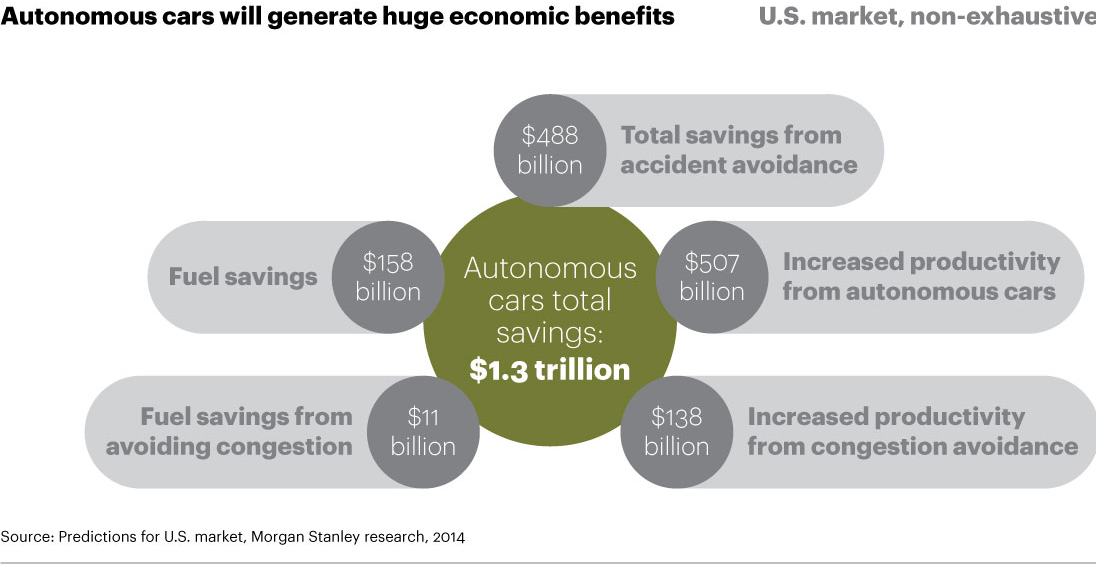
Morgan Stanley Estimate of economic impact of Driverless Cars

Chapter 1 - Page 21
Market Capitalization 2006 vs 2016 shows near total disappearance of once dominant oil companies in just 10 years.
Chapter 1 - Page 23
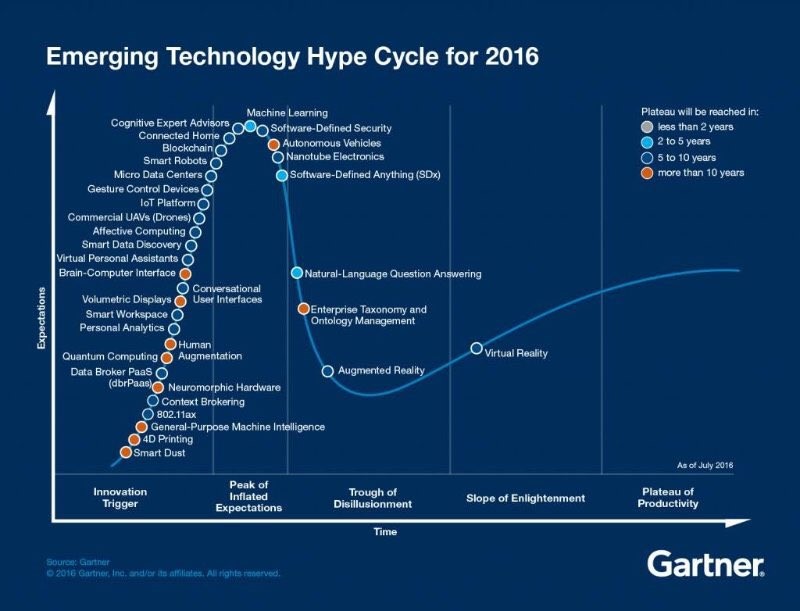
Gartner Hype Cycle (2016 Edition)

Chapter 2 - Page 34
Peak Horse - courtesy of Barclays

Chapter 2 - Page 44
US Bureau of Labor Statistics - Share of Household Expenditure

Chapter 2 - Page 56
Wall Street Journal graph - % of Age Groups getting Driver's Licenses
Chapter 3 - Page 75
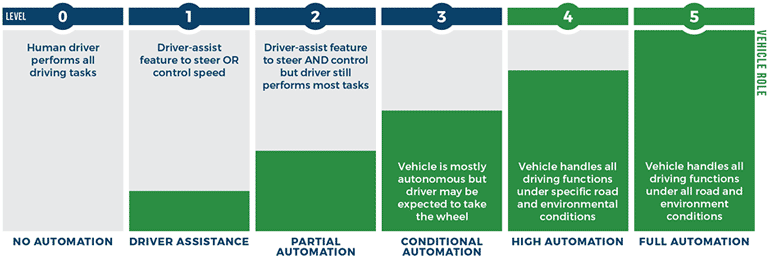
The levels of driverless cars 0-5 explained
Chapter 3 - Page 79
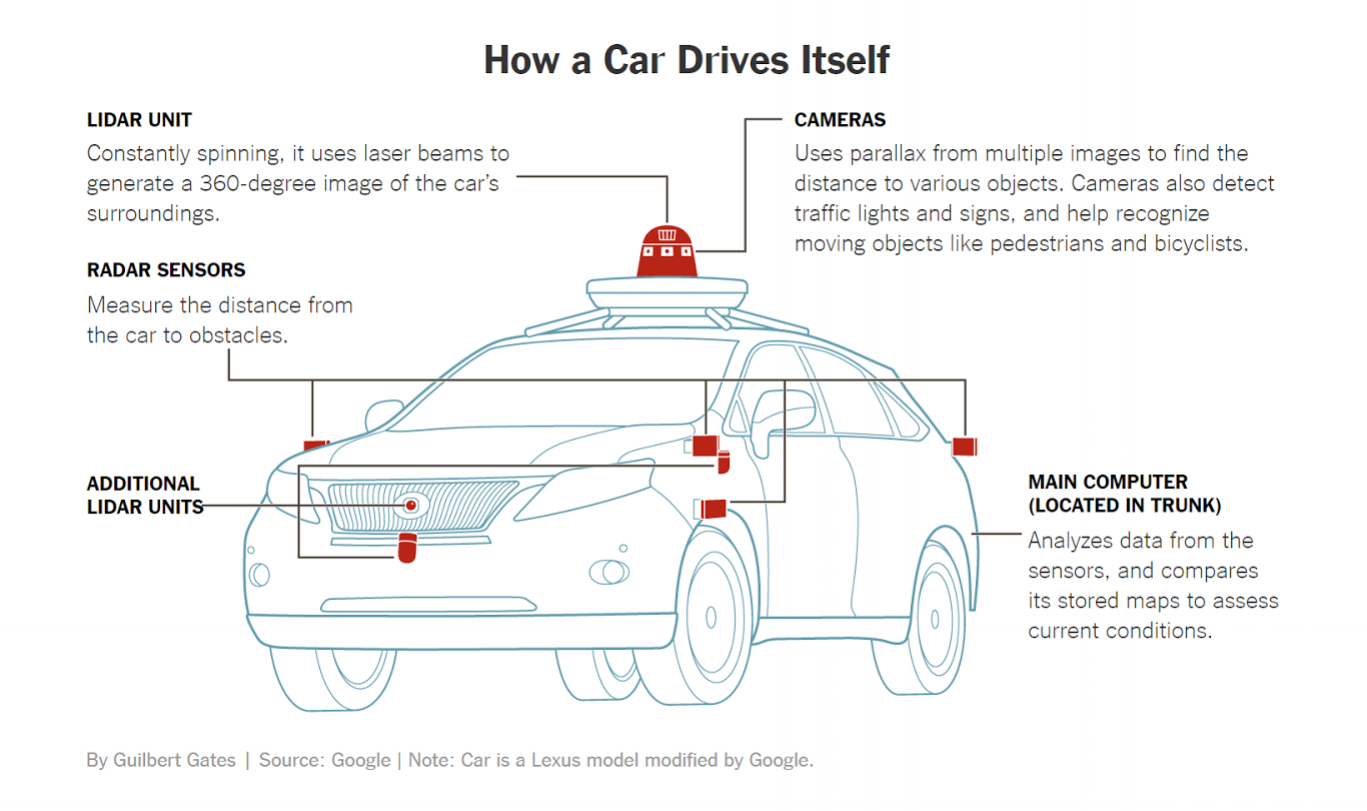
New York Times illustration of Sensors on a Driverless Car.
Chapter 3 - Page 79
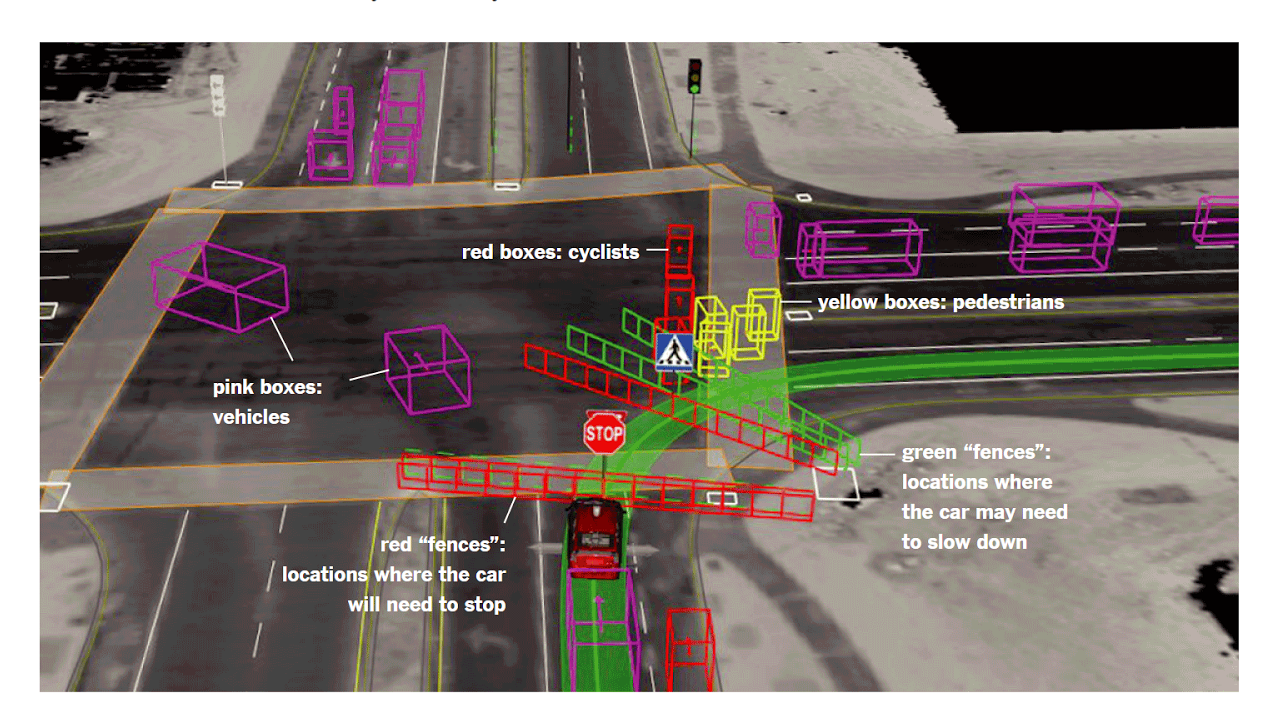
The LiDAR view created and interpreted by a Google Driverless Car.
Chapter 3 - Page 84
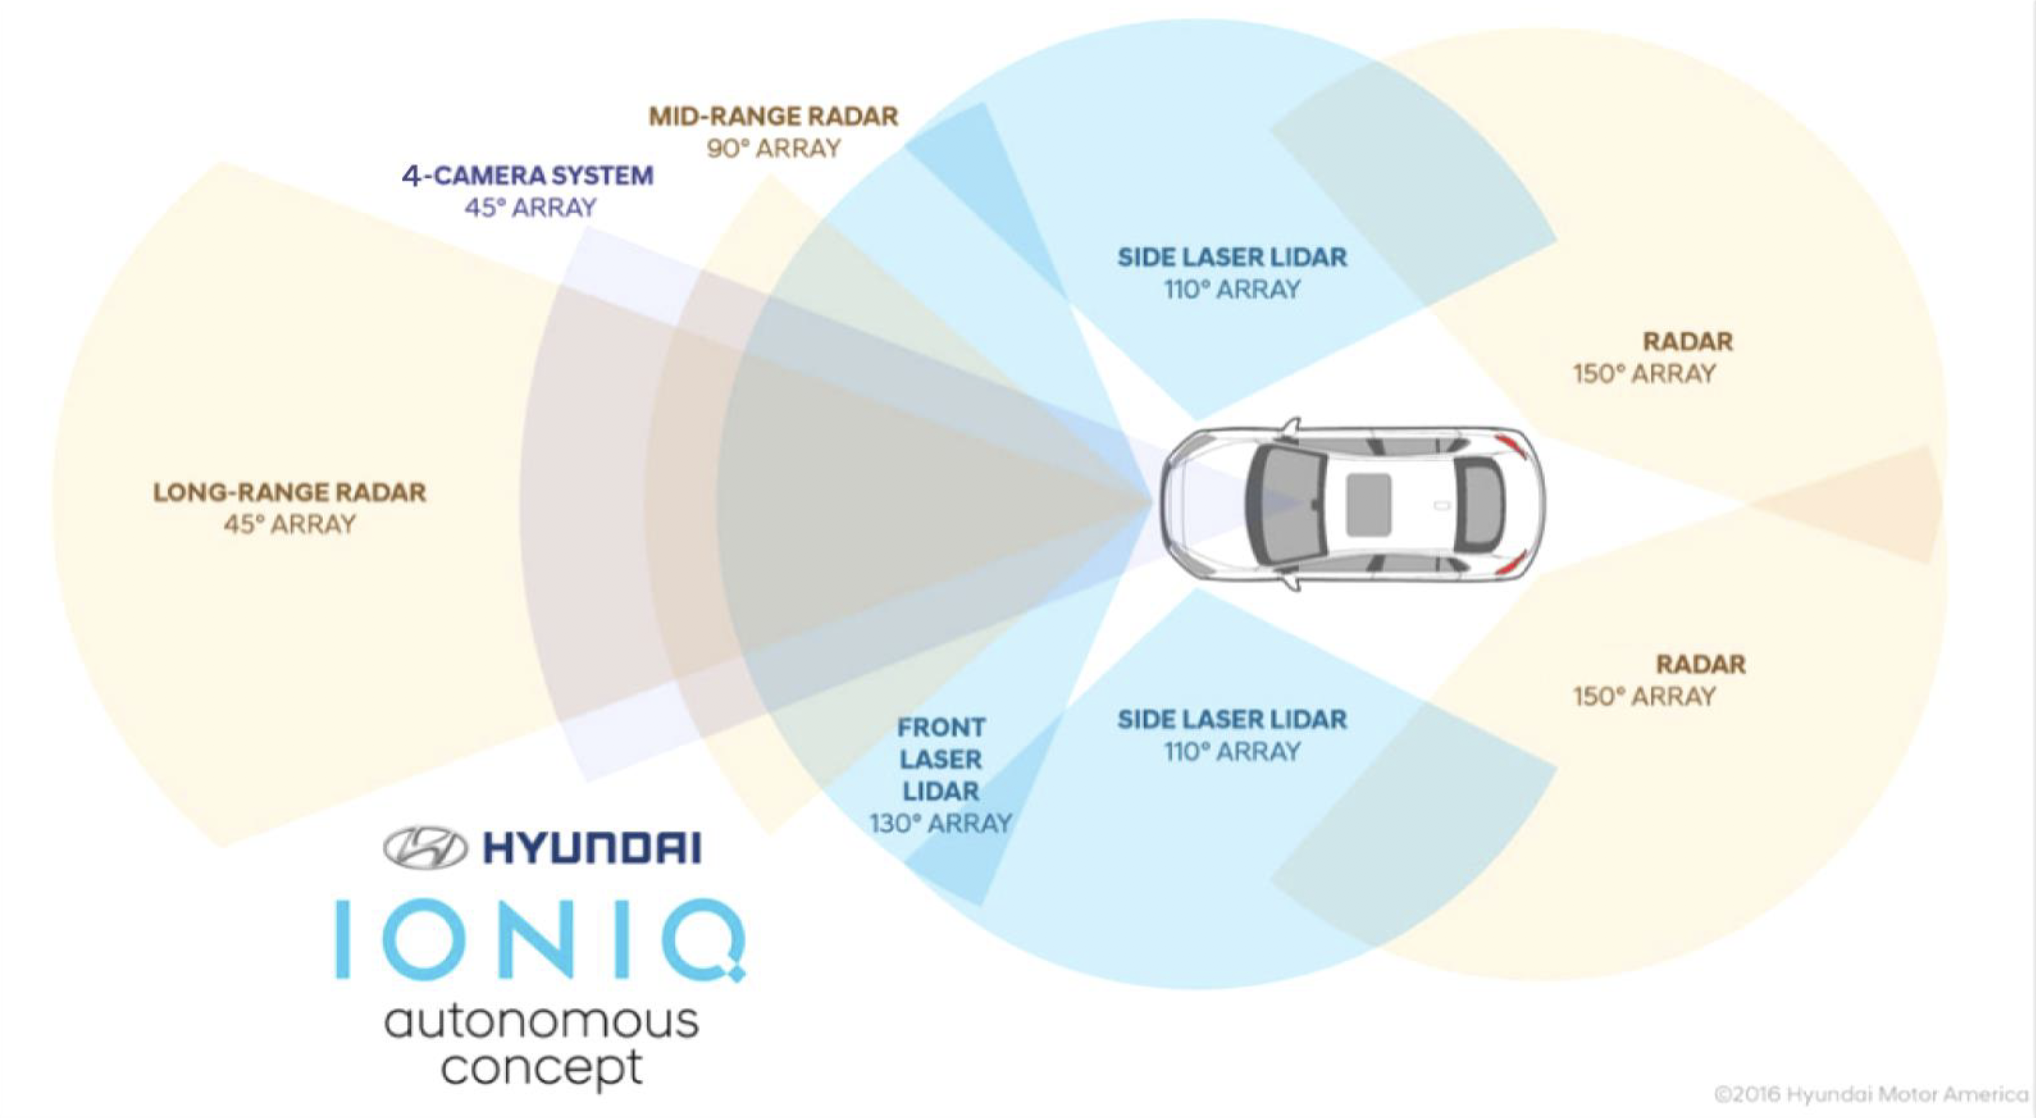
Hyundai's Sensor Suite coverage
<- Direction of Travel

Chapter 3 - Page 84
Tesla's sensor suite coverage. Direction of Travel ->

Chapter 3 - Page 86
The computing power in the trunk of a Ford prototype. Image credit: Sam Abuelsamid

Chapter 3 - Page 90
Snow Testing in Tahoe, courtesy of Waymo.

Chapter 3 - Page 91
MCity Driverless cars testing facility

Chapter 3 - Page 93
A trip computer when displays were just 1"

Chapter 3 - Page 94
The massive 17" display in a Tesla

Chapter 3 - Page 94
The Automatic dongle you can add to your car to track details via an App.
Chapter 3 - Page 95
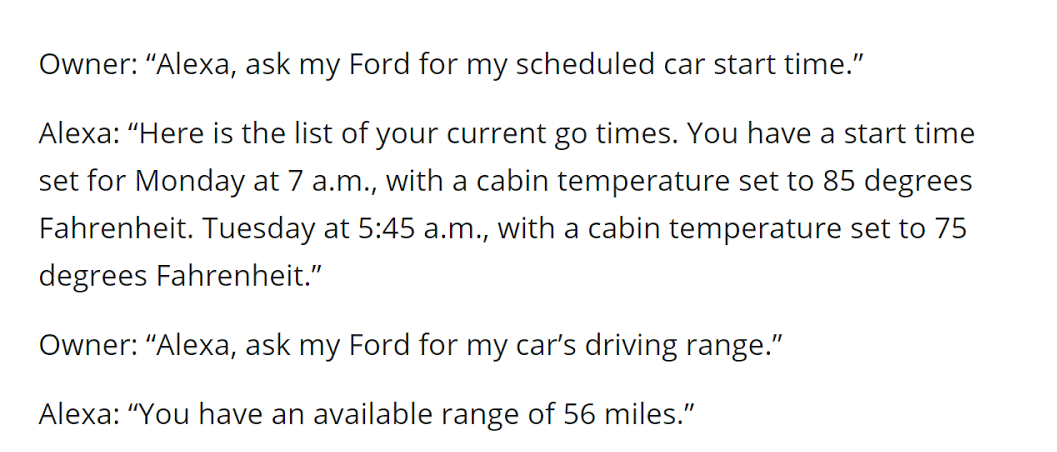
Example conversation possible between a Ford Sync user and Amazon's Alexa

Chapter 3 - Page 98
CBRE map showing the self driving activity around San Francisco & Silicon Valley.

Chapter 3 - Page 99
Waymo FCA Minivan, 600 of which are on trial in Arizona
Chapter 3 - Page 103
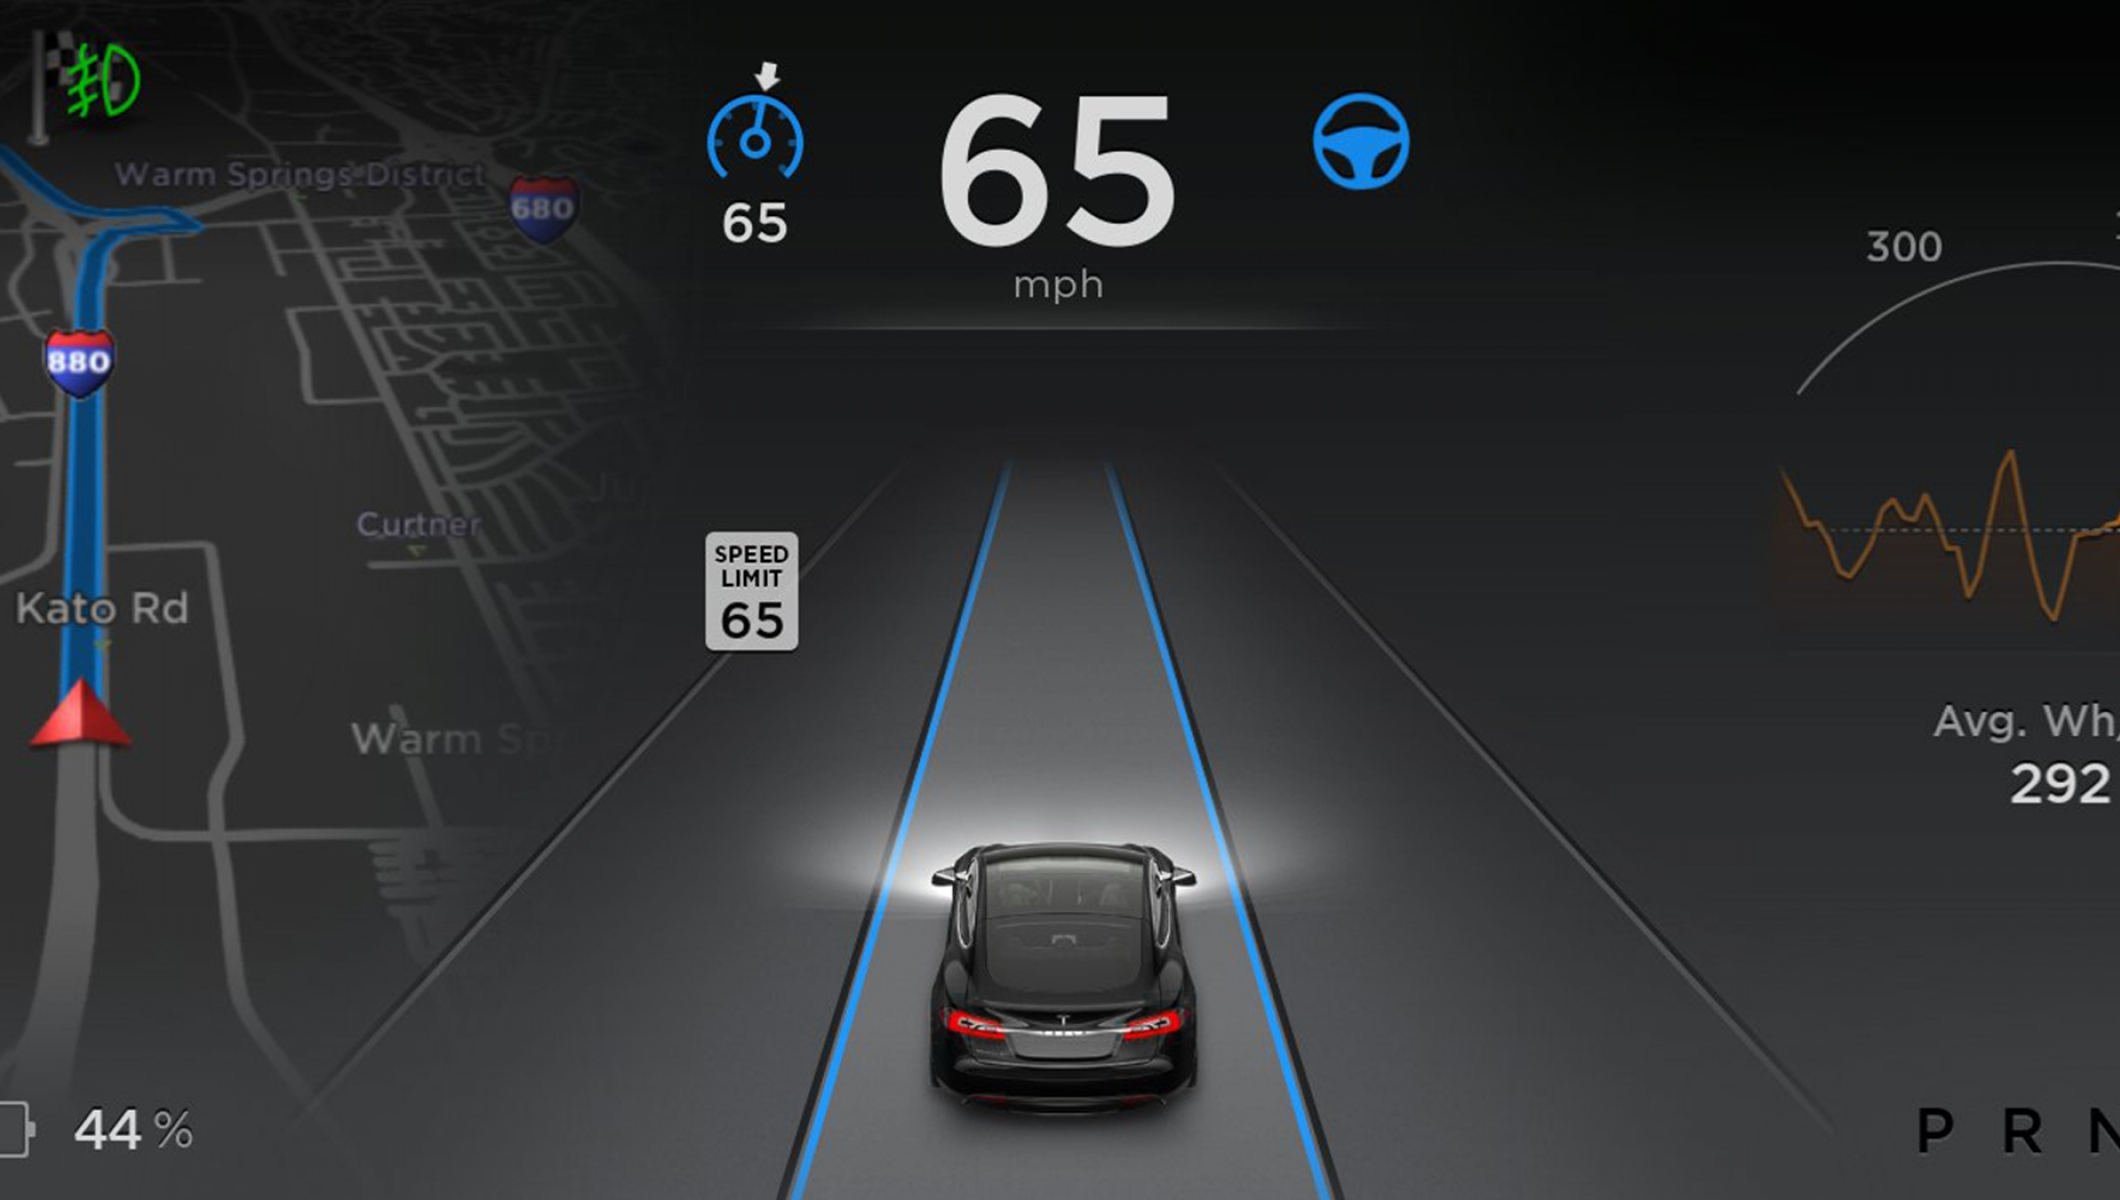
Autopilot Indication on Tesla Dashboard

Chapter 3 - Page 106
Early Uber prototype with very prominent sensor arrays.

Chapter 3 - Page 107
Uber prototype Volvo XC-90

Chapter 3 - Page 108
Image of Baidu's prototype for self driving technology developments.
Chapter 3 - Page 112
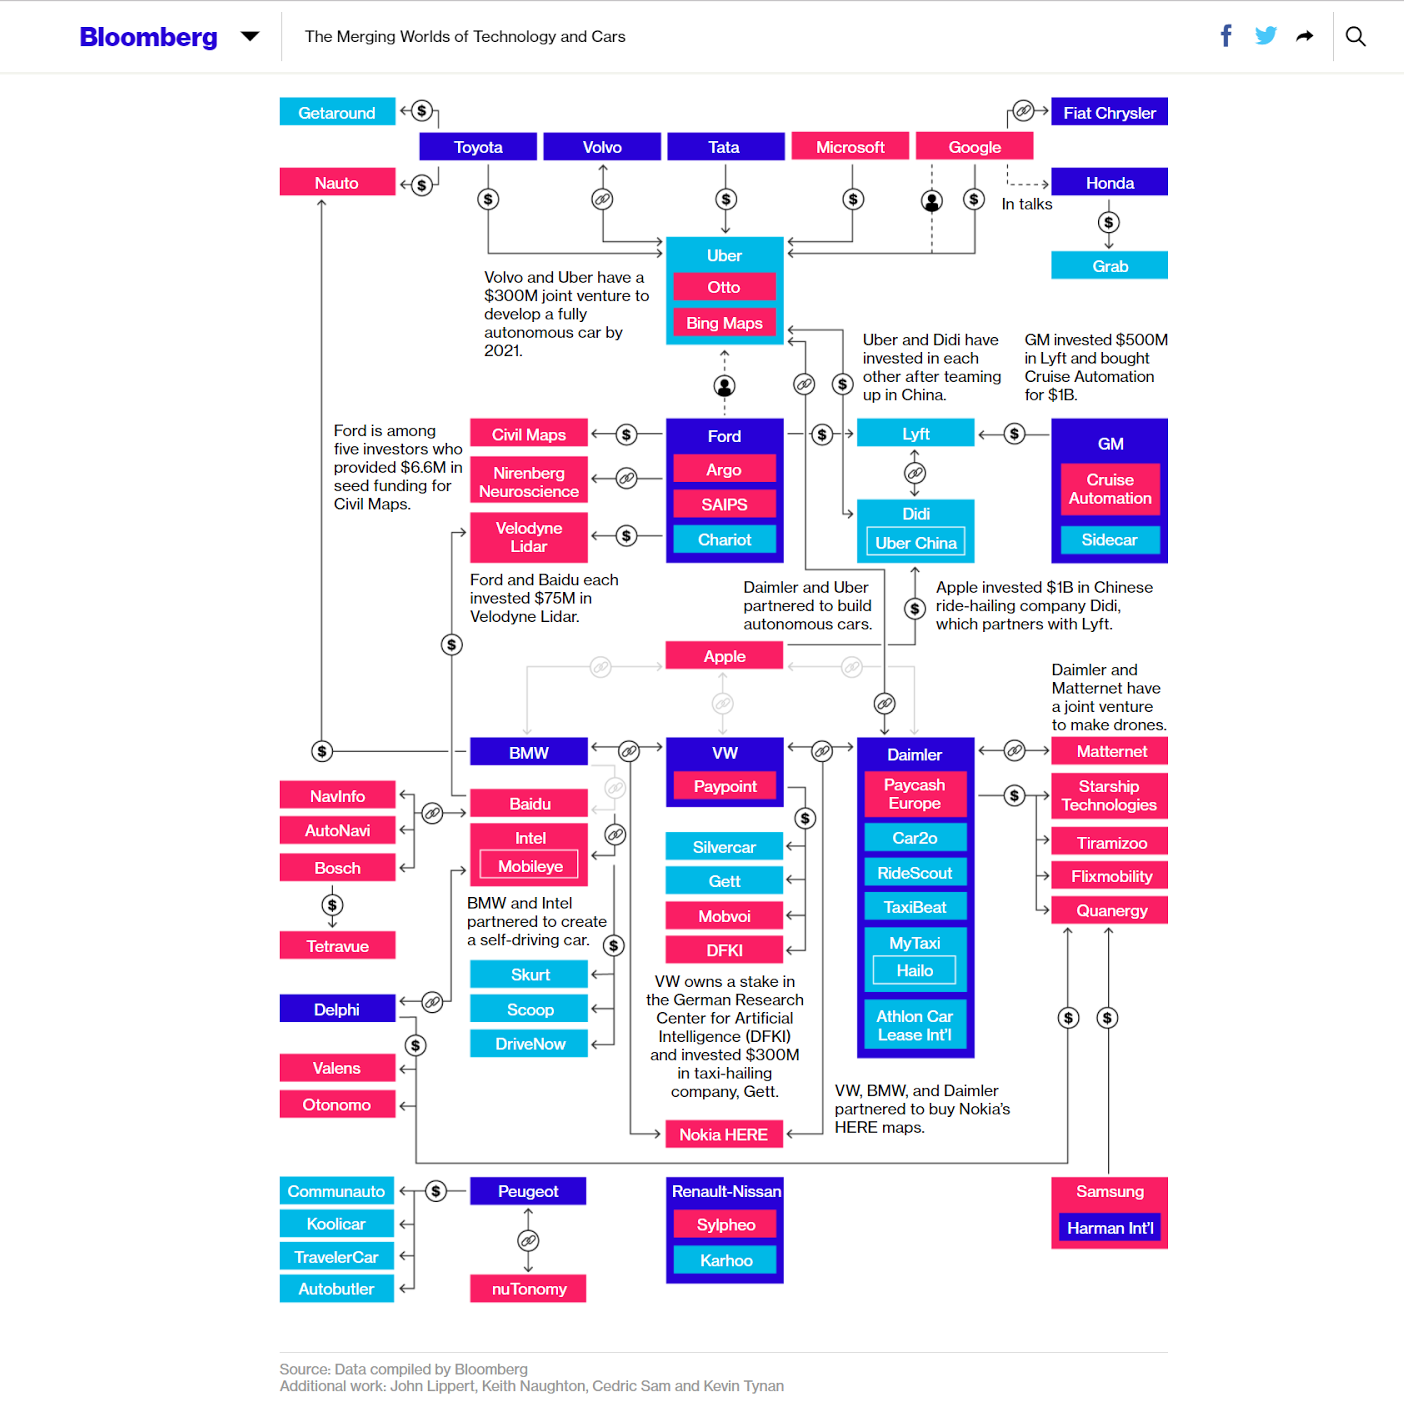
Static image of Bloomberg's Interactive guide to alliances in the self-driving technology space. Also recommend Reuters guide.

Chapter 3 - Page 113
The latest Ford driverless car showing much less prominent LiDAR sensors.
Chapter 3 - Page 116
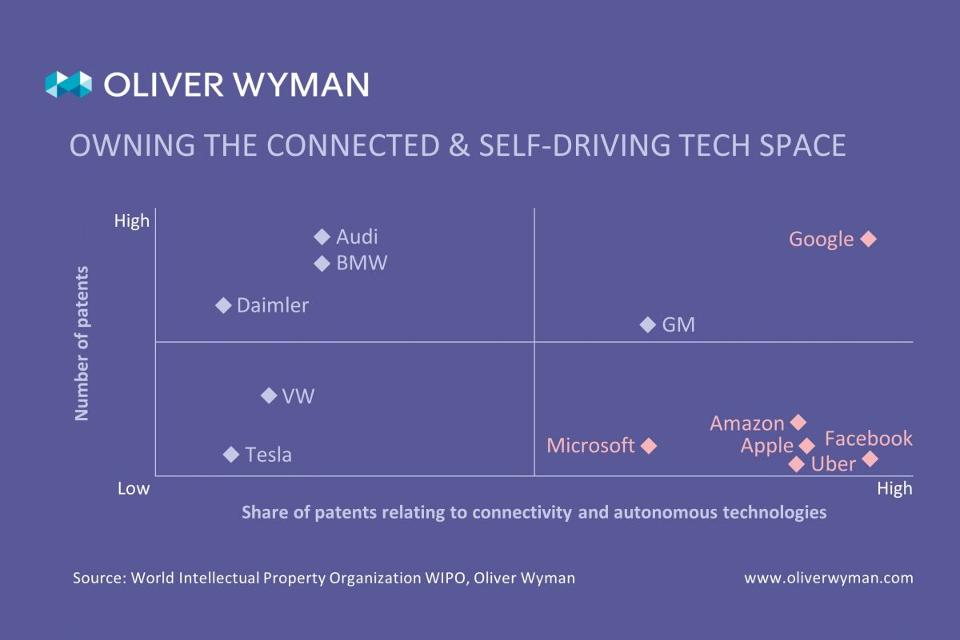
Patents Ownership mapped by Oliver Wyman
Chapter 4 - Page 133
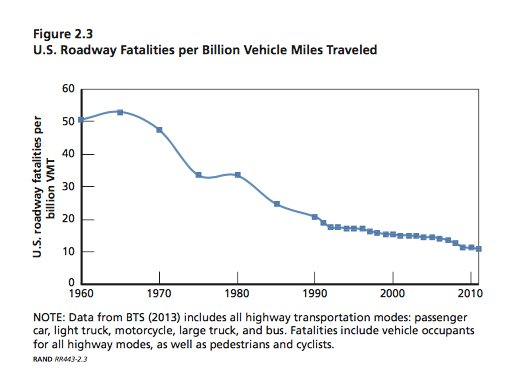
Fatalities per Billion Vehicle Miles Traveled (VMT) trended since 1960.
Chapter 4 - Page 134
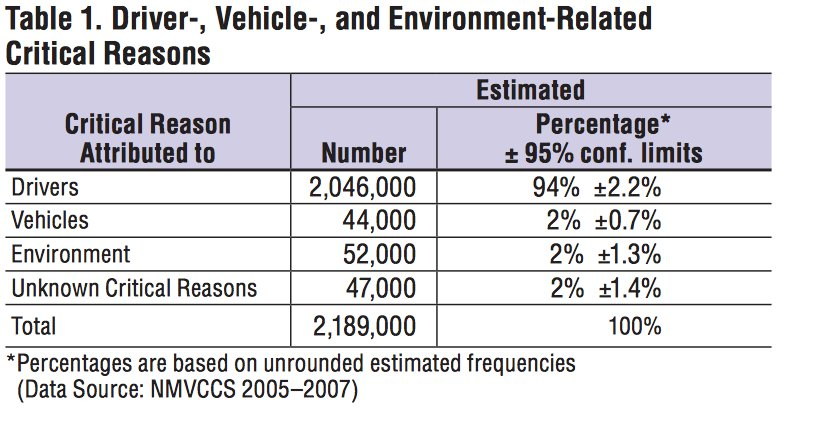
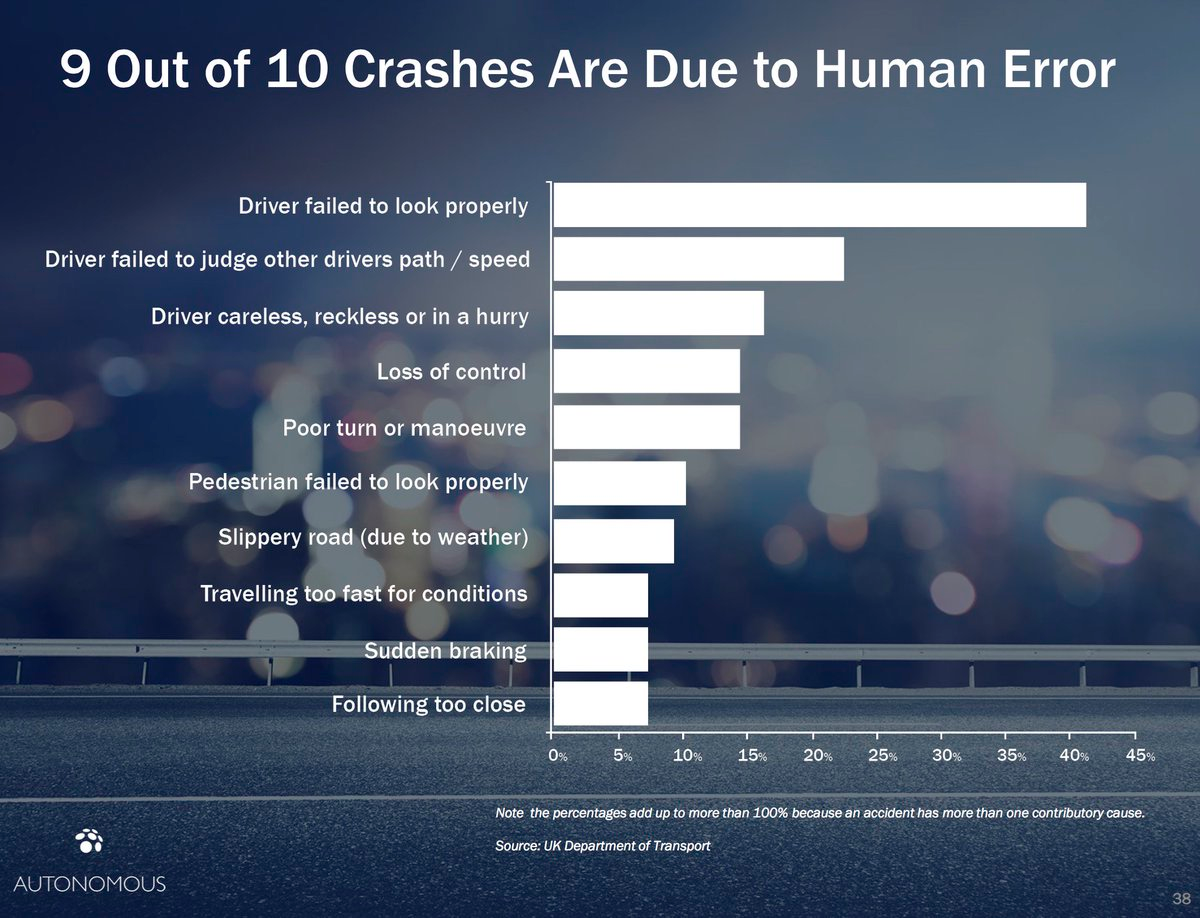
Causes of Crashes - US Data
Chapter 4 - Page 135
Detailed breakdown of Human Error causes of crashes, from Autonomous.

Chapter 4 - Page 139
Rand Corporation report showing weight of cars.

Chapter 5 - Page 147
Tesla sticker - no tailpipe required.

Chapter 5 - Page 147
No human controls necessary...
Chapter 5 - Page 150
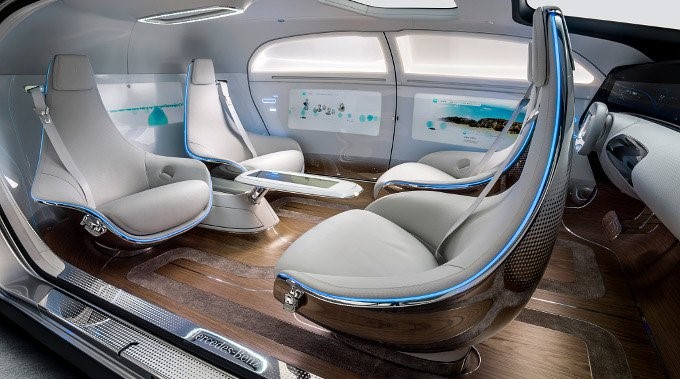
Mercedes Benz concept car interior for driverless future.
Chapter 5 - Page 150
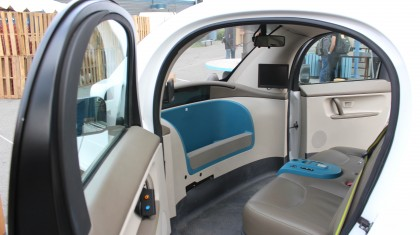
Interior of Google's Firefly concept driverless car showing no controls and a storage area where there would normally be a dashboard.

Chapter 5 - Page 150
Concept car showing front entry when no steering wheel is required.

Chapter 5 - Page 164
GM's Maven App

Chapter 5 - Page 164
Daimler's Croove App

Chapter 5 - Page 178
Chart showing the relative changes in energy consumption forecast for driverless vehicles
Chapter 5 - Page 191
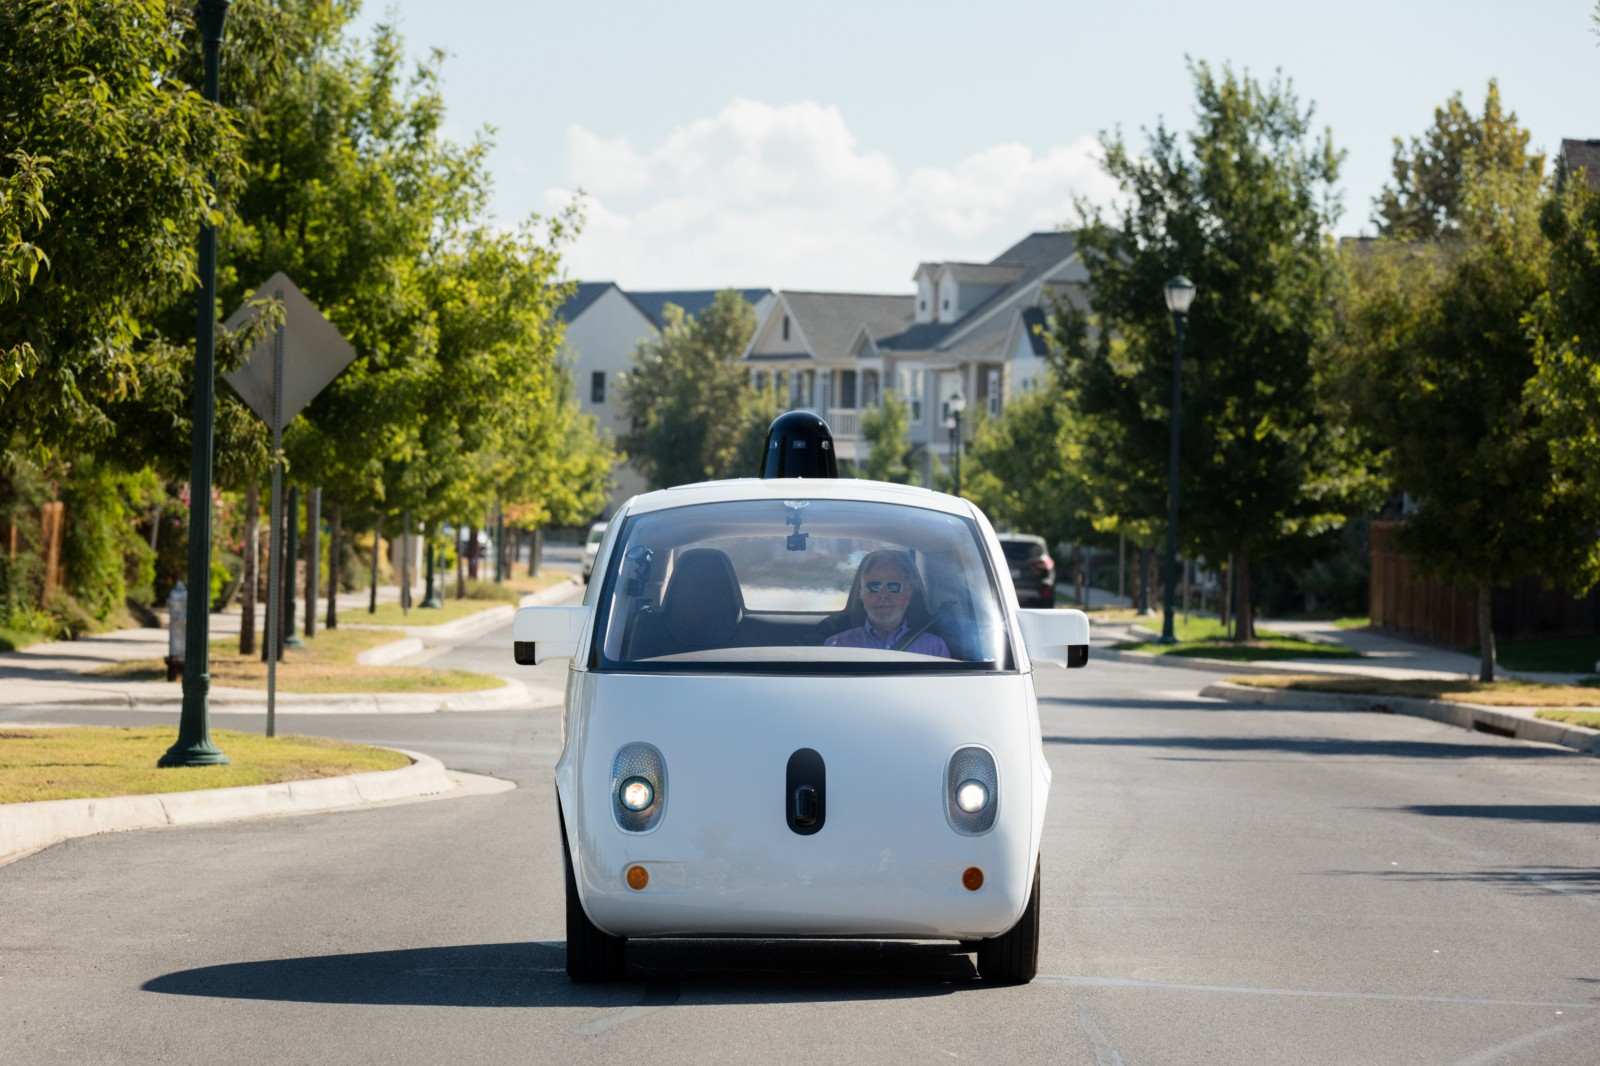
Legally Blind rider in a Google prototype driverless car in 2015 in Austin, TX.

Chapter 6 - Page 204
Example of driverless bus being testing in Helsinki, Finland

Chapter 6 - Page 204
Example of driverless bus being testing in Greenwich, London.

Chapter 6 - Page 210
Example 2 of a sign that could confuse a driverless car into thinking it's a traffic signal

Chapter 6 - Page 210
Example 2 of a sign that could confuse a driverless car into thinking it's a traffic signal

Chapter 6 - Page 212
Audi dashboard indicator trial showing traffic signal status (Red) and remaining seconds to change (6 seconds)

Chapter 6 - Page 214
Google Patent application showing concept signs for pedestrian interactions.

Chapter 6 - Page 215
Knightscope security robot patrols a mall in Standford, CA

Chapter 6 - Page 216
Starship Robots take away delivery trial in London

Chapter 6 - Page 221
Example 2 of sign warning motorists not to veer for deer
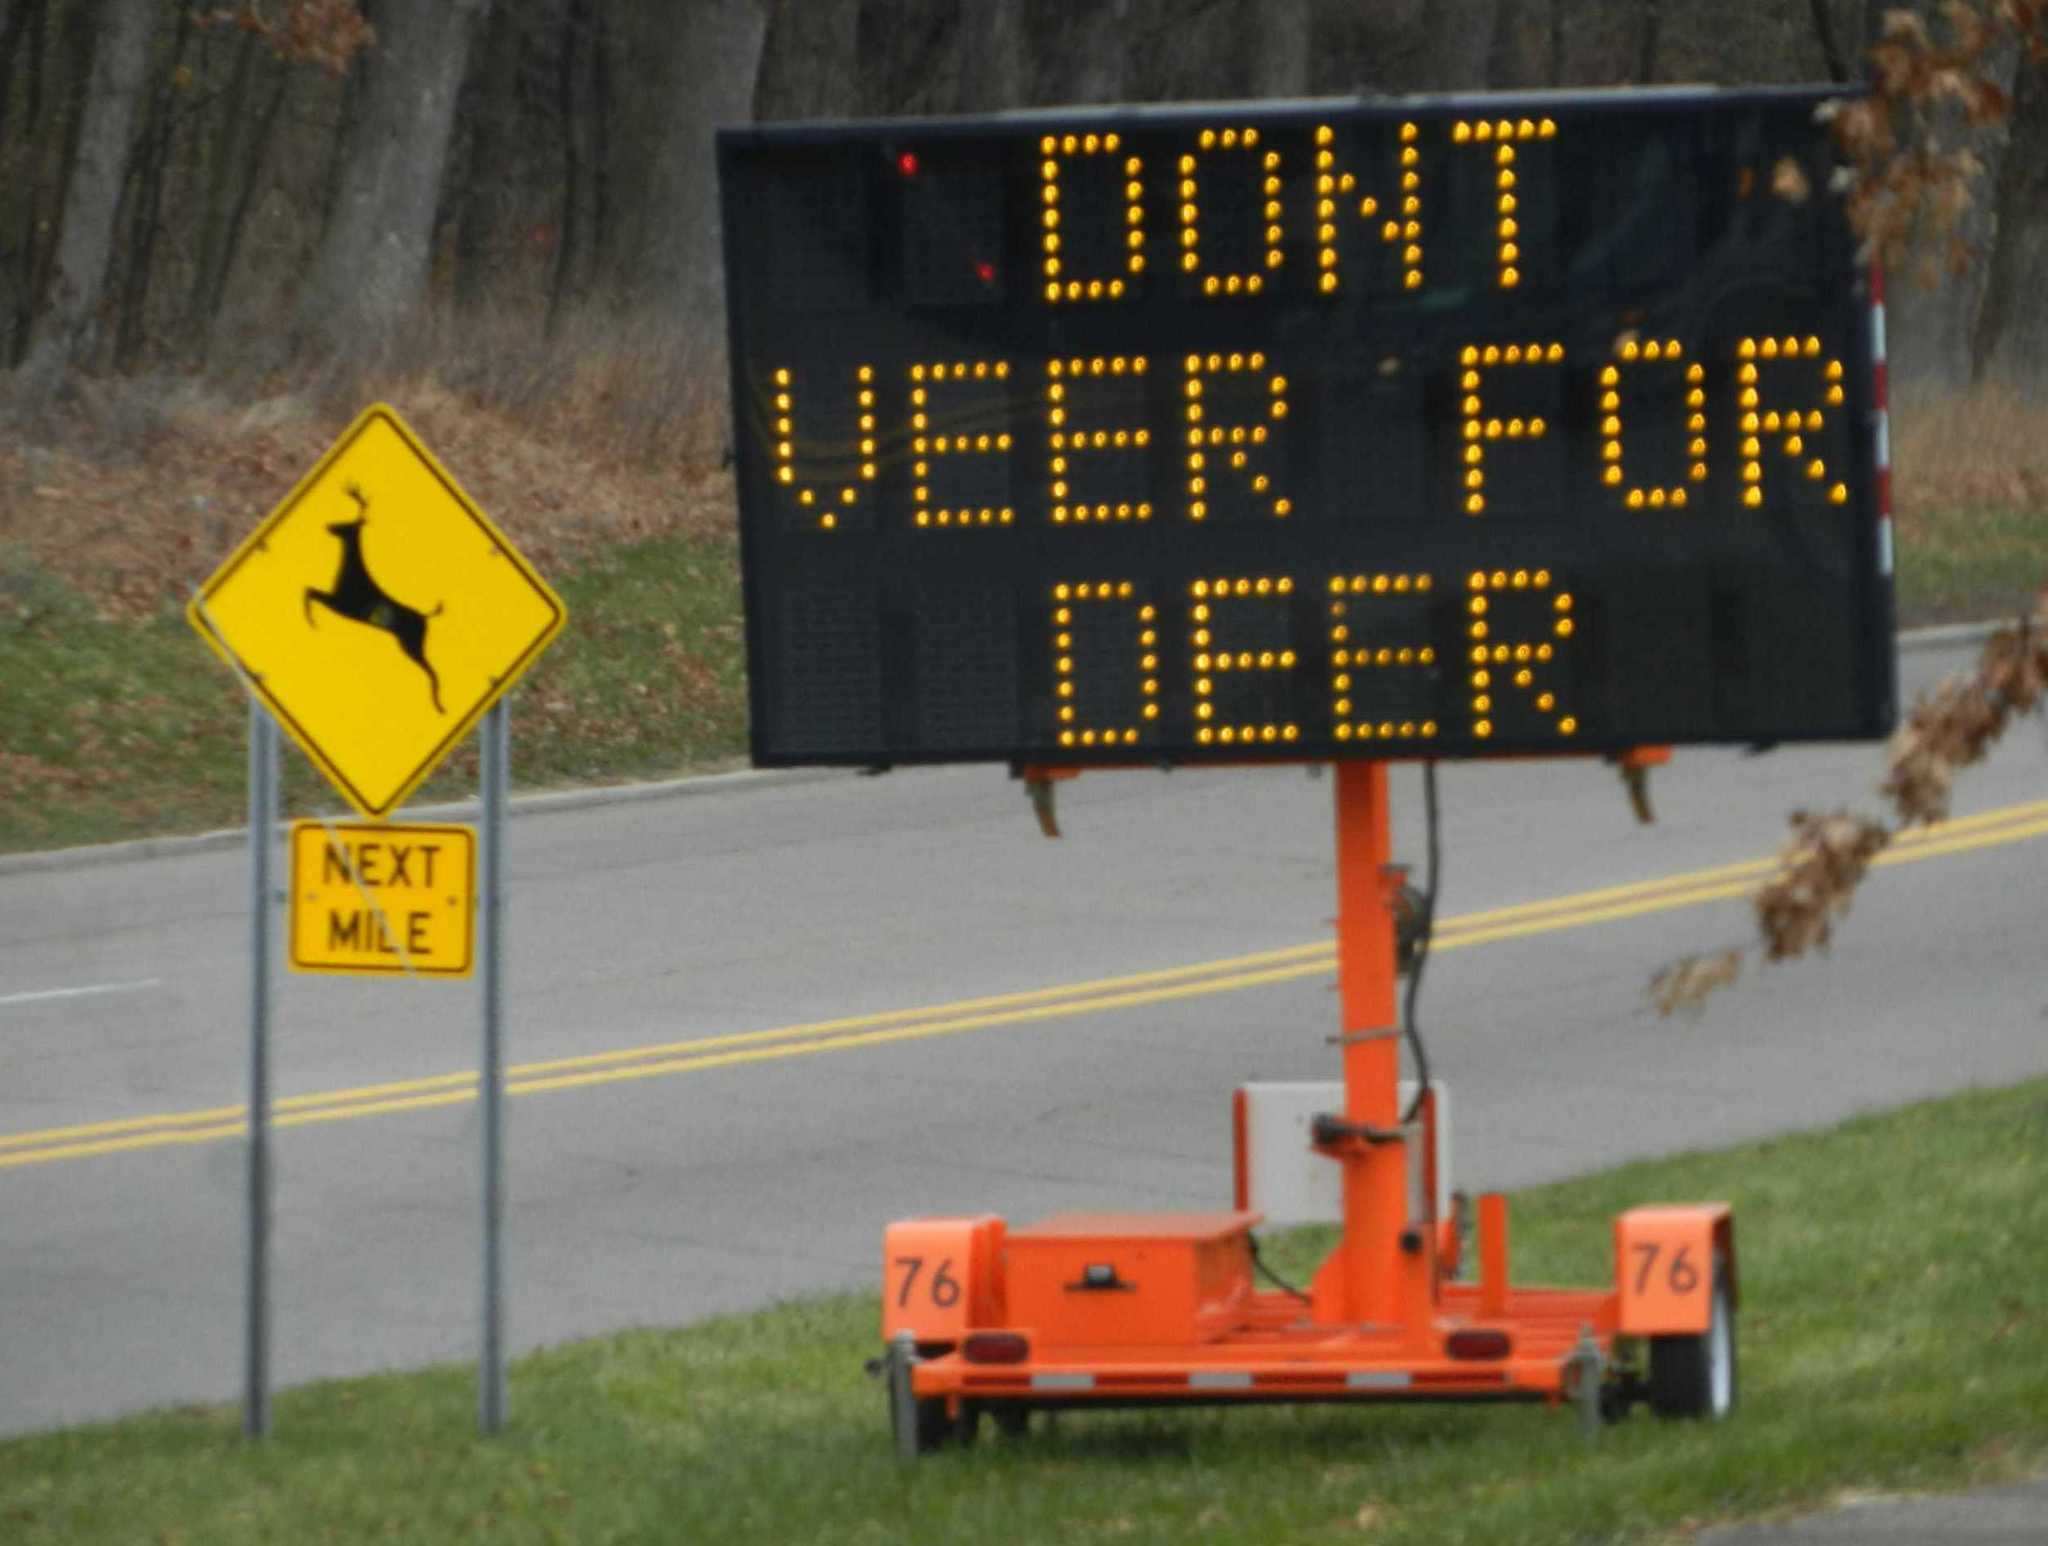
Chapter 6 - Page 221
Example 2 of sign warning motorists not to veer for deer
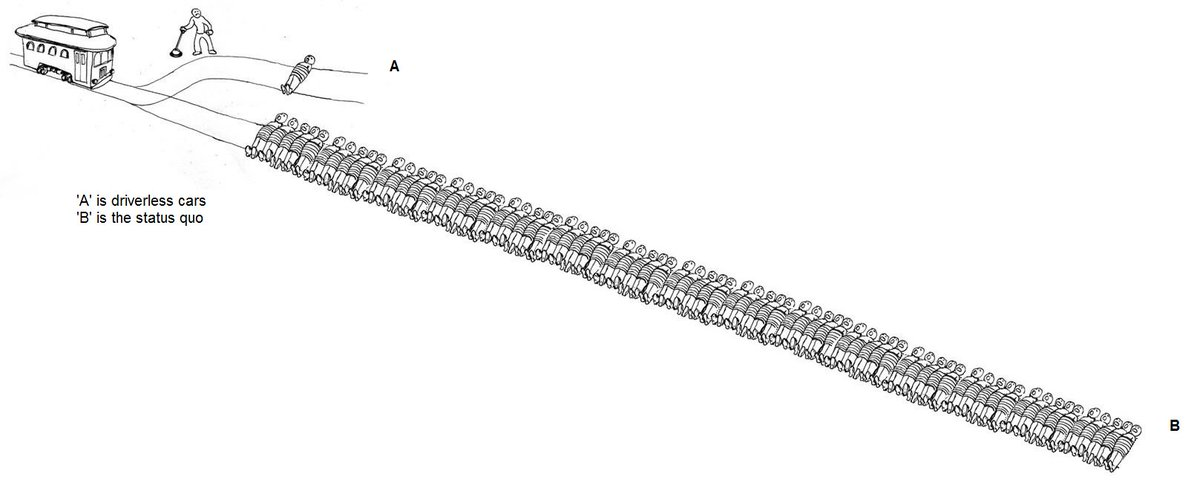
Chapter 6 - Page 230
Image showing Trolley decision between the status quo and the promise of driverless cars. Image courtesy of Caleb Watney (@CalebWatney)

Chapter 6 - Page 232
New York Times graph showing the relative speed of consumer adoption for previous technologies.

Chapter 6 - Page 234
McKinsey graph showing scenarios for the transition to Driverless cars up to 2040

Chapter 7 - Page 275
The Interior of an Uber Driverless Car prototype showing riders the LiDAR view generated by the car.


