Contact

David-Kerrigan.com

Contact
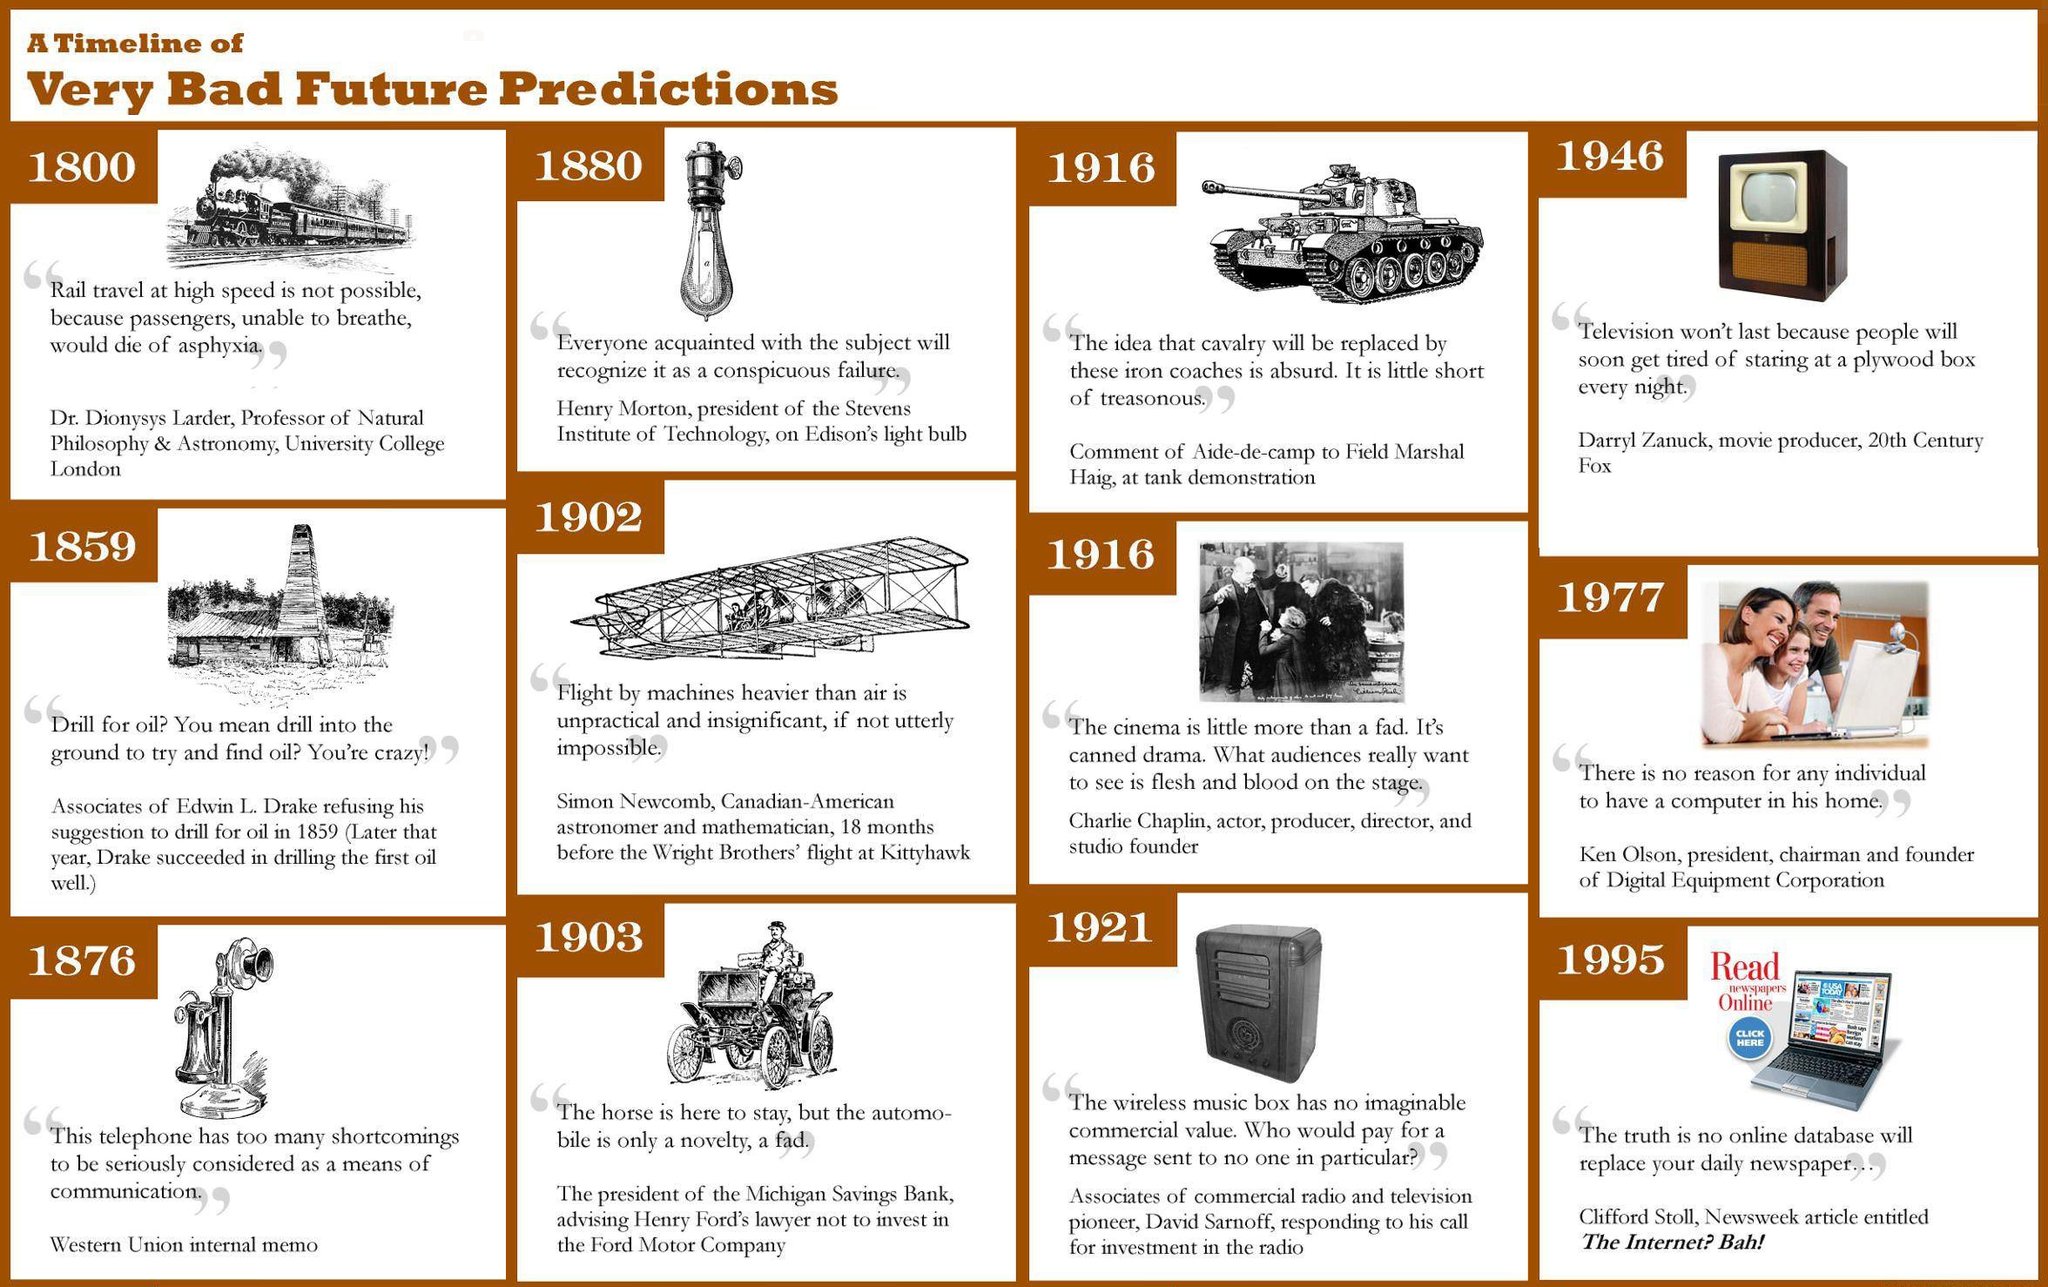
 Chapter 1 Figure 1: Very Bad Predictions. Source: http://infographic.city/timeline-bad-future-predictions/

Chapter 1 Figure 1: Very Bad Predictions. Source: http://infographic.city/timeline-bad-future-predictions/

 Chapter 2 Figure 2: We now expect free instant access to any information. Source: http://officialshoebox.tumblr.com/post/165805010726/hbd-google-thanks-for-giving-us-access-to-all-of
Chapter 2 Figure 2: We now expect free instant access to any information. Source: http://officialshoebox.tumblr.com/post/165805010726/hbd-google-thanks-for-giving-us-access-to-all-of

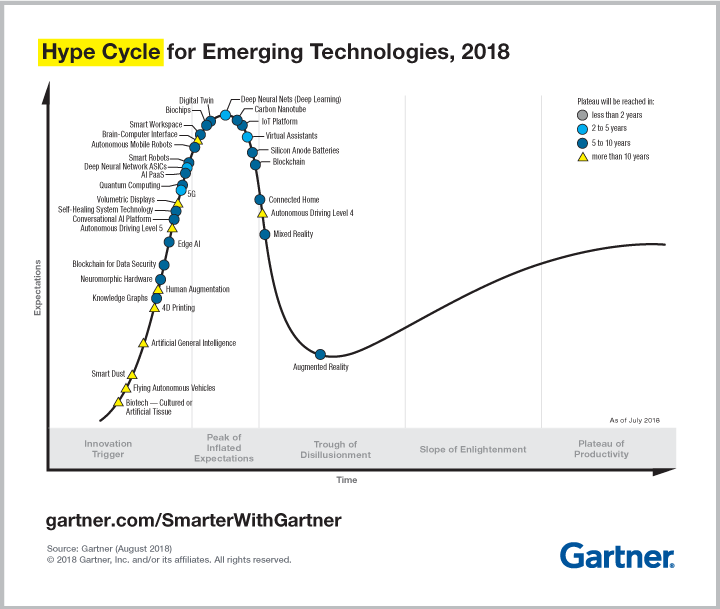
 Chapter 2 Figure 3: 2018 Gartner Hype Cycle for Emerging Technologies. Source: https://www.gartner.com/en/newsroom/press-releases/2018-08-20-gartner-identifies-five-emerging-technology-trends-that-will-blur-the-lines-between-human-and-machine

Chapter 2 Figure 3: 2018 Gartner Hype Cycle for Emerging Technologies. Source: https://www.gartner.com/en/newsroom/press-releases/2018-08-20-gartner-identifies-five-emerging-technology-trends-that-will-blur-the-lines-between-human-and-machine

 Chapter 2 Figure 4: The Adoption Curve. Source: http://weblog.tetradian.com/2016/08/09/tech-adoption-tech-evolution-lifecycle-mgmt/

Chapter 2 Figure 4: The Adoption Curve. Source: http://weblog.tetradian.com/2016/08/09/tech-adoption-tech-evolution-lifecycle-mgmt/

 Chapter 2 Figure 5: Years to widespread adoption. Source: @mikequindazzi

Chapter 2 Figure 5: Years to widespread adoption. Source: @mikequindazzi

 Chapter 2 Figure 6: The S-Curve. Source: http://robotwatch.co/s-curves-comparative-advantage

Chapter 2 Figure 6: The S-Curve. Source: http://robotwatch.co/s-curves-comparative-advantage

 Chapter 2 Figure 7: The S Curve. Source: Andreessen Horotwitz

Chapter 2 Figure 7: The S Curve. Source: Andreessen Horotwitz

 Chapter 2 Figure 8: Blackberry Sales. Source: Andreessen Horotwitz

Chapter 2 Figure 8: Blackberry Sales. Source: Andreessen Horotwitz

 Chapter 3 Figure 9: International Soccer game on Commodore 64, 1983

Chapter 3 Figure 9: International Soccer game on Commodore 64, 1983

 Chapter 3 Figure 10: FIFA 2017 Soccer game by EA, 2017

Chapter 3 Figure 10: FIFA 2017 Soccer game by EA, 2017

 Chapter 3 Figure 11: The Evolution of Tomb Raider Graphics 1996 to 2014 thanks to improved processing speeds. Source: https://www.halloweencostumes.com/blog/p-468-tomb-raider-infographic.aspx
Chapter 3 Figure 11: The Evolution of Tomb Raider Graphics 1996 to 2014 thanks to improved processing speeds. Source: https://www.halloweencostumes.com/blog/p-468-tomb-raider-infographic.aspx

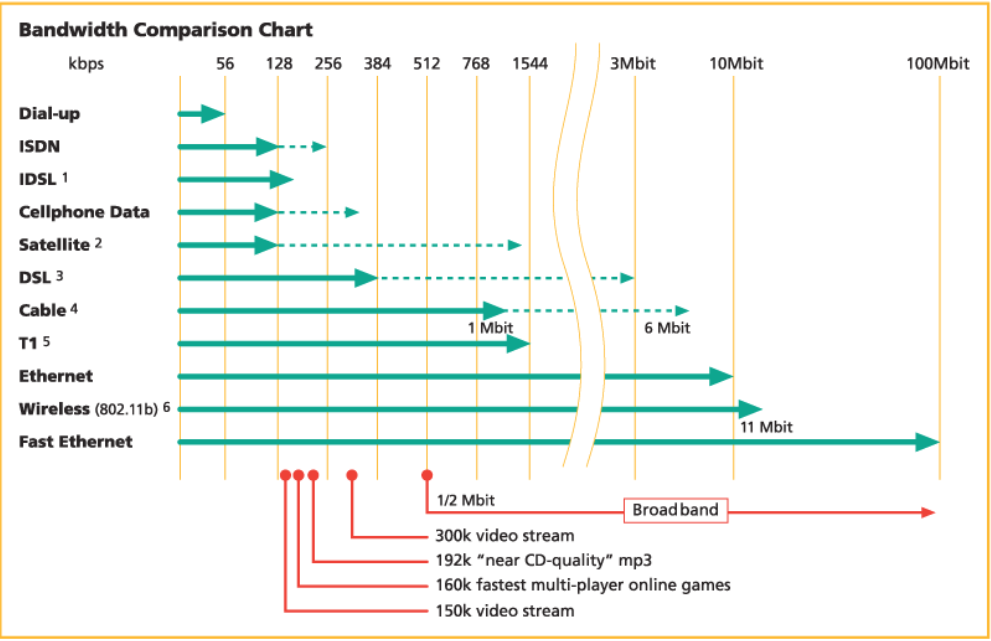
 Chapter 3 Figure 12: Fixed Line Connectivity Speed Improvements. Source: http://www.woltercomputers.com/blog/2014/06/10/bandwidth-comparison-chart

Chapter 3 Figure 12: Fixed Line Connectivity Speed Improvements. Source: http://www.woltercomputers.com/blog/2014/06/10/bandwidth-comparison-chart

 Chapter 3 Figure 13: Internet Seconds in 2018. Source: https://www.allaccess.com/merge/archive/28030/2018-update-what-happens-in-an-internet-minute#sthash.IKyiTou1.uxfs

Chapter 3 Figure 13: Internet Seconds in 2018. Source: https://www.allaccess.com/merge/archive/28030/2018-update-what-happens-in-an-internet-minute#sthash.IKyiTou1.uxfs

 Chapter 3 Figure 14: Declining Price of Personal Computers. Source: Bloomberg via https://twitter.com/ValaAfshar

Chapter 3 Figure 14: Declining Price of Personal Computers. Source: Bloomberg via https://twitter.com/ValaAfshar

 Chapter 3 Figure 15: Data Connections between Chicago and New York. Source: https://www.zerohedge.com/news/chicago-new-york-and-back-85-milliseconds

Chapter 3 Figure 15: Data Connections between Chicago and New York. Source: https://www.zerohedge.com/news/chicago-new-york-and-back-85-milliseconds

 Chapter 3 Figure 16: An Apple A11 CPU in an iPhone (contains 4.3 billion transistors). Source: Best Mobile Destination

Chapter 3 Figure 16: An Apple A11 CPU in an iPhone (contains 4.3 billion transistors). Source: Best Mobile Destination

 Chapter 3 Figure 17: GPU Performance. Source: Nvidia
Chapter 3 Figure 17: GPU Performance. Source: Nvidia

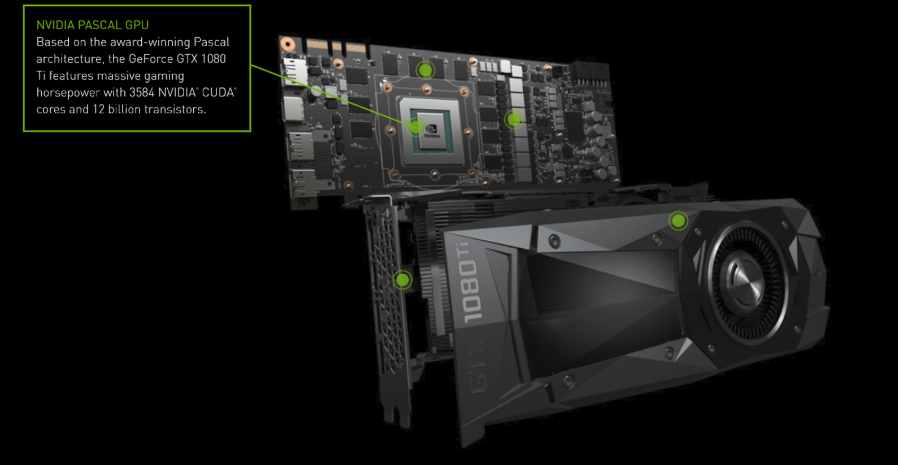
 Chapter 3 Figure 18: An Nvidia GPU for a desktop PC - with 12 billion transistors. Source: Nvidia

Chapter 3 Figure 18: An Nvidia GPU for a desktop PC - with 12 billion transistors. Source: Nvidia

 Chapter 3 Figure 19: A Microsoft Executive holding an FPGA board. Source: Microsoft
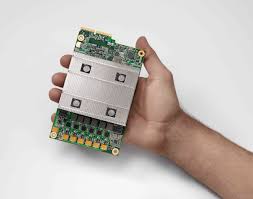
Chapter 3 Figure 19: A Microsoft Executive holding an FPGA board. Source: Microsoft

 Chapter 3 Figure 20: A Google TPU. Source: Google

Chapter 3 Figure 20: A Google TPU. Source: Google

 Chapter 3 Figure 21: A Google Edge TPU. Source Google

Chapter 3 Figure 21: A Google Edge TPU. Source Google

 Chapter 3 Figure 22: The Summit Supercomputer. Source: Carlos Jones, Oak Ridge National Laboratory/U.S. Dept. of Energy
Chapter 3 Figure 22: The Summit Supercomputer. Source: Carlos Jones, Oak Ridge National Laboratory/U.S. Dept. of Energy

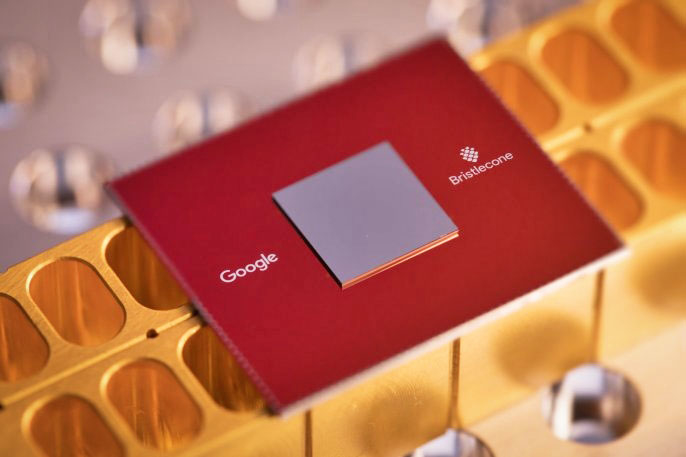
 Chapter 3 Figure 23: A Google Bristlecone Quantum chip. Source: Google

Chapter 3 Figure 23: A Google Bristlecone Quantum chip. Source: Google

 Chapter 3 Figure 24: 1956 IBM Model 350 hard disk with 4Mb storage capacity. Source: http://historydaily.org/the-worlds-first-computer-with-data-storage

Chapter 3 Figure 24: 1956 IBM Model 350 hard disk with 4Mb storage capacity. Source: http://historydaily.org/the-worlds-first-computer-with-data-storage

 Chapter 3 Figure 25: A 1.44Mb floppy disk and a Micro SD card which can be upto 512Gb.

Chapter 3 Figure 25: A 1.44Mb floppy disk and a Micro SD card which can be upto 512Gb.

 Chapter 3 Figure 26: Average web page size (in KB). Source https://speedcurve.com/blog/web-performance-page-bloat/

Chapter 3 Figure 26: Average web page size (in KB). Source https://speedcurve.com/blog/web-performance-page-bloat/

 Chapter 3 Figure 27: Wi-Fi Speeds. Source https://10techy.com/802-11ac-or-802-11n/

Chapter 3 Figure 27: Wi-Fi Speeds. Source https://10techy.com/802-11ac-or-802-11n/

 Chapter 3 Figure 28: Cellular Connectivity Speeds. Source: http://nimbuzz.com/us/article/technology/5g-yay-or-nay-227

Chapter 3 Figure 28: Cellular Connectivity Speeds. Source: http://nimbuzz.com/us/article/technology/5g-yay-or-nay-227

 Chapter 3 Figure 29: Genome Sequencing Costs over time. Source genome.gov/sequencingcostsdata

Chapter 3 Figure 29: Genome Sequencing Costs over time. Source genome.gov/sequencingcostsdata

 Chapter 3 Figure 31: Uber speeds up a decades-old process. Source:  https://www.slideshare.net/schlaf/on-demand-everything

Chapter 3 Figure 31: Uber speeds up a decades-old process. Source: https://www.slideshare.net/schlaf/on-demand-everything

 Chapter 3 Figure 32: Pace Layers. Source: https://www.pinterest.ie/pin/266838346645832089/

Chapter 3 Figure 32: Pace Layers. Source: https://www.pinterest.ie/pin/266838346645832089/

 Chapter 4 Figure 33: Publication of AI Papers. Source: https://aiindex.org/2017-report.pdf

Chapter 4 Figure 33: Publication of AI Papers. Source: https://aiindex.org/2017-report.pdf

 Chapter 4 Figure 34: Publication of AI Papers. Source: https://aiindex.org/2017-report.pdf

Chapter 4 Figure 34: Publication of AI Papers. Source: https://aiindex.org/2017-report.pdf

 Chapter 4 Figure 35: The emergence of AI, ML and DL. Source: https://medium.com/mmc-writes/the-fourth-industrial-revolution-a-primer-on-artificial-intelligence-ai-ff5e7fffcae1

Chapter 4 Figure 35: The emergence of AI, ML and DL. Source: https://medium.com/mmc-writes/the-fourth-industrial-revolution-a-primer-on-artificial-intelligence-ai-ff5e7fffcae1

 Chapter 4 Figure 36: Typical Machine Learning Flow

Chapter 4 Figure 36: Typical Machine Learning Flow

 Chapter 4 Figure 37: Layers in a (simplified) Neural Network Source: https://medium.com/mmc-writes/the-fourth-industrial-revolution-a-primer-on-artificial-intelligence-ai-ff5e7fffcae1
Chapter 4 Figure 37: Layers in a (simplified) Neural Network Source: https://medium.com/mmc-writes/the-fourth-industrial-revolution-a-primer-on-artificial-intelligence-ai-ff5e7fffcae1

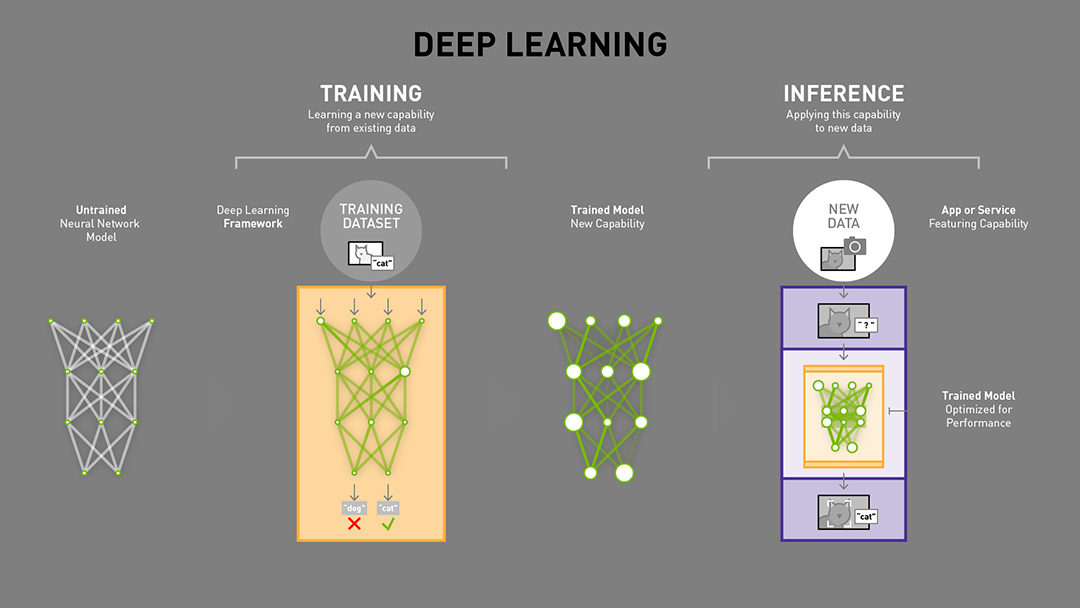
 Chapter 4 Figure 38: Training and Inference. Source: Nvidia

Chapter 4 Figure 38: Training and Inference. Source: Nvidia

 Chapter 4 Figure 39 GPUs driving speed improvements in Training Speeds. Source: Nvidia

Chapter 4 Figure 39 GPUs driving speed improvements in Training Speeds. Source: Nvidia
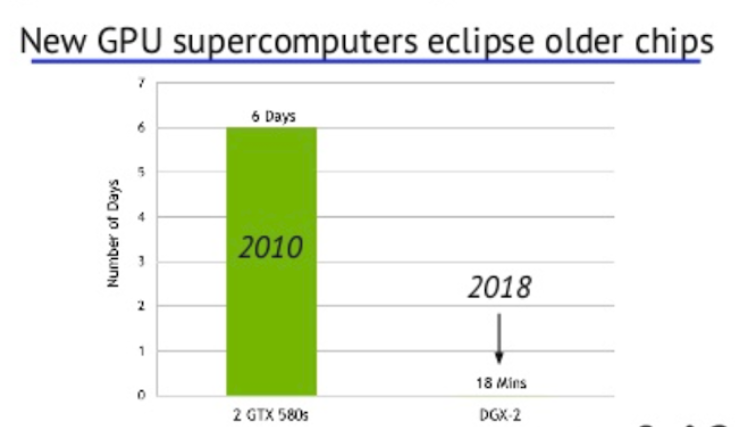
 Chapter 4 Figure 40: A model that took 6 days in 2010 can run in 18 minutes now. Source: https://www.slideshare.net/nb410/the-state-of-artificial-intelligence-in-2018-a-good-old-fashioned-report-103568798

Chapter 4 Figure 40: A model that took 6 days in 2010 can run in 18 minutes now. Source: https://www.slideshare.net/nb410/the-state-of-artificial-intelligence-in-2018-a-good-old-fashioned-report-103568798

 Chapter 4 Figure 41: Global Internet Data Traffic - note logarithmic scale. Source: https://medium.com/mmc-writes/the-fourth-industrial-revolution-a-primer-on-artificial-intelligence-ai-ff5e7fffcae1

Chapter 4 Figure 41: Global Internet Data Traffic - note logarithmic scale. Source: https://medium.com/mmc-writes/the-fourth-industrial-revolution-a-primer-on-artificial-intelligence-ai-ff5e7fffcae1

 Chapter 4 Figure 42: Data Creation Rate in Zettabytes. Source: https://www.kleinerperkins.com/perspectives/internet-trends-report-2018

Chapter 4 Figure 42: Data Creation Rate in Zettabytes. Source: https://www.kleinerperkins.com/perspectives/internet-trends-report-2018

 Chapter 4 Figure 43: Popular AI Frameworks available for free download. Source: https://www.slideshare.net/jiangjun1990/gdgshanghai-2017-tensorflow-summit-recap

Chapter 4 Figure 43: Popular AI Frameworks available for free download. Source: https://www.slideshare.net/jiangjun1990/gdgshanghai-2017-tensorflow-summit-recap

 Chapter 4 Figure 44: Deep Learning’s impact on Image Recognition Tests. Source: https://medium.com/mmc-writes/the-fourth-industrial-revolution-a-primer-on-artificial-intelligence-ai-ff5e7fffcae1

Chapter 4 Figure 44: Deep Learning’s impact on Image Recognition Tests. Source: https://medium.com/mmc-writes/the-fourth-industrial-revolution-a-primer-on-artificial-intelligence-ai-ff5e7fffcae1
 Chapter 4 Figure 45: Deep Learning’s impact on Speech Recognition Tests. Source: https://medium.com/mmc-writes/the-fourth-industrial-revolution-a-primer-on-artificial-intelligence-ai-ff5e7fffcae1

Chapter 4 Figure 45: Deep Learning’s impact on Speech Recognition Tests. Source: https://medium.com/mmc-writes/the-fourth-industrial-revolution-a-primer-on-artificial-intelligence-ai-ff5e7fffcae1

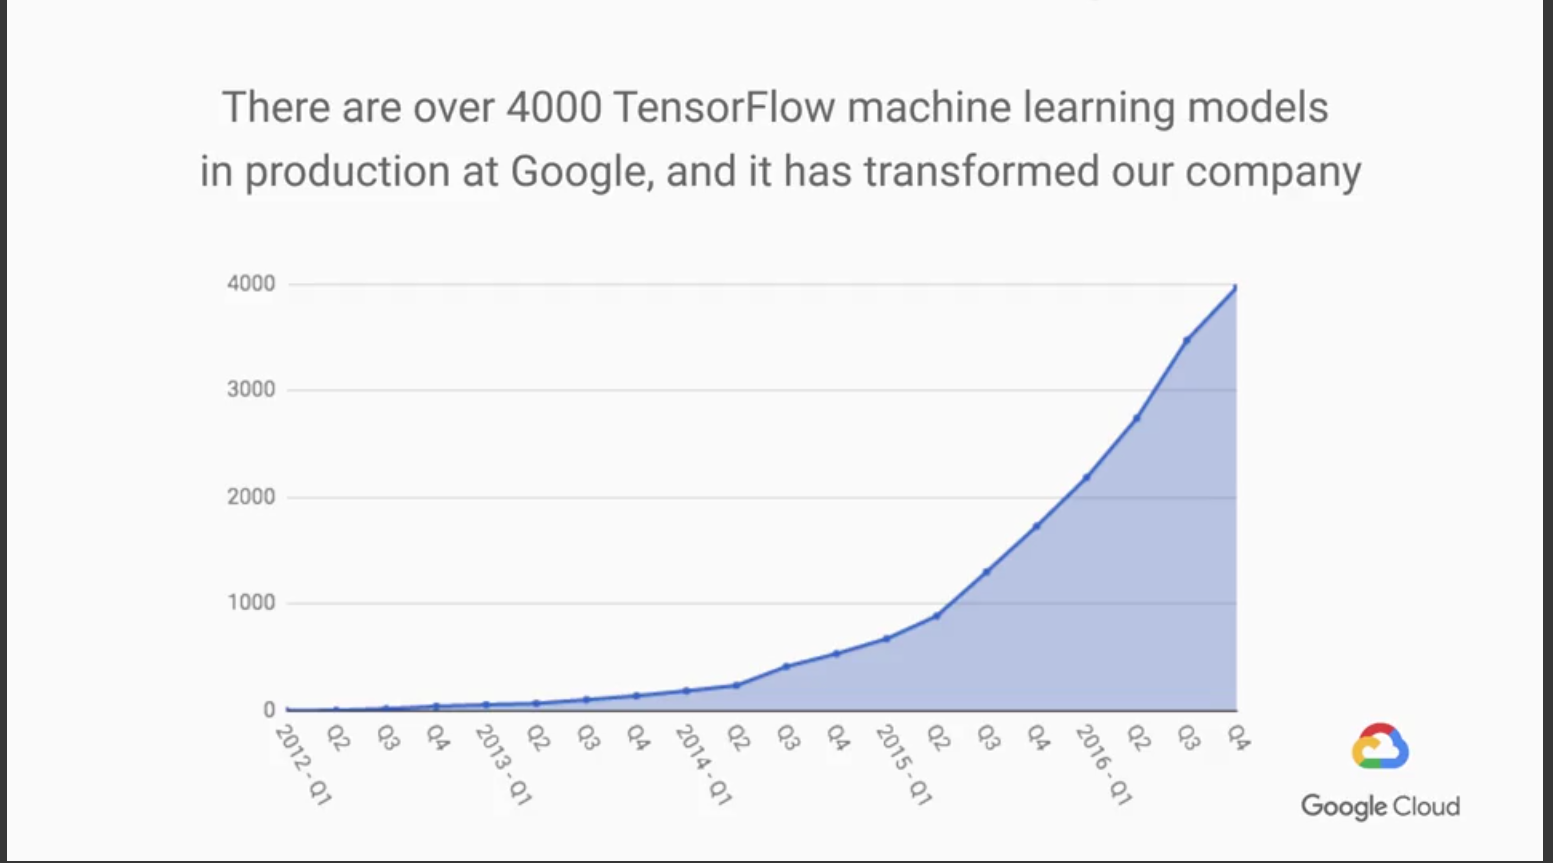
 Chapter 4 Figure 46: ML Use in Google. Source: Google Cloud
Chapter 4 Figure 46: ML Use in Google. Source: Google Cloud

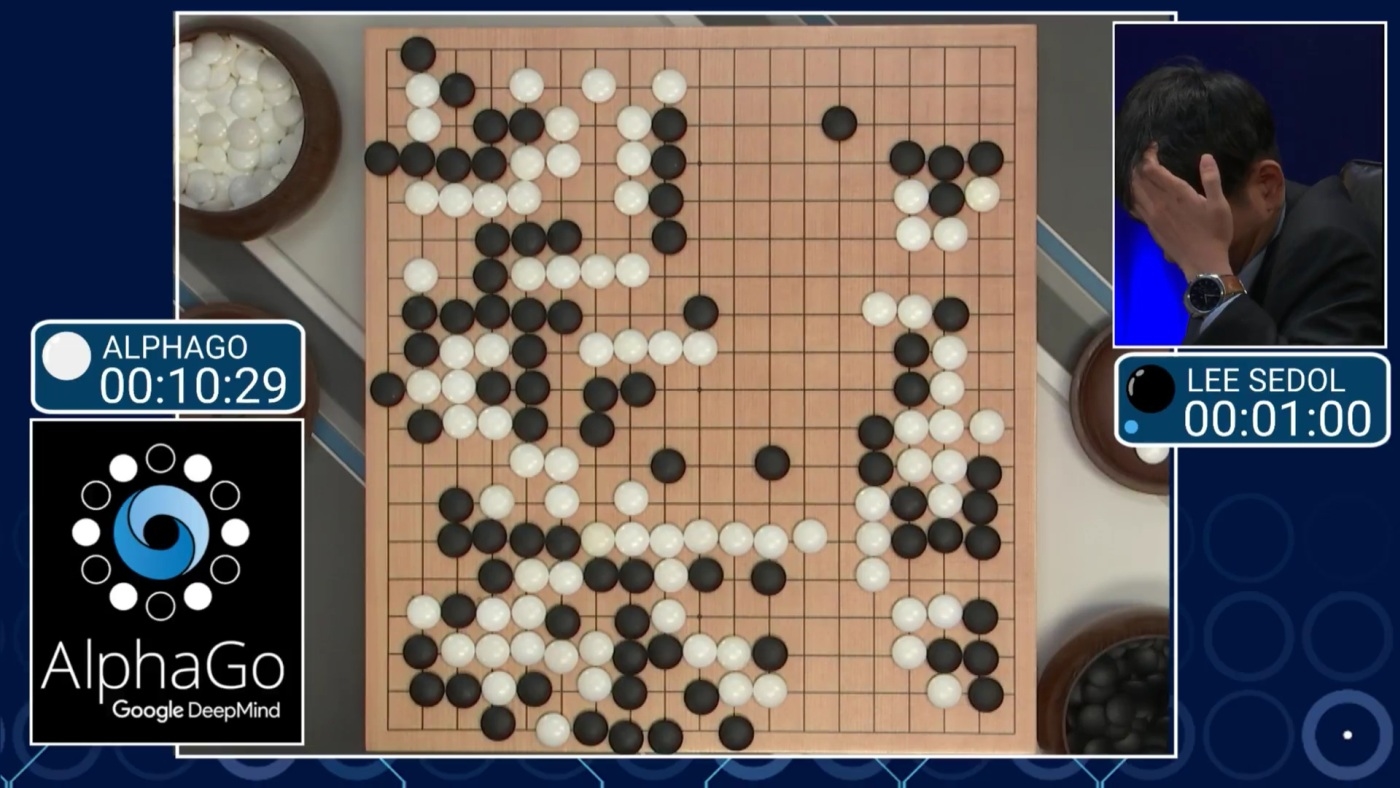
 Chapter 4 Figure 47: AlphaGo in action. Source: DeepMind

Chapter 4 Figure 47: AlphaGo in action. Source: DeepMind

 Chapter 4 Figure 48: FB Learner. Source:  https://www.zdnet.com/article/how-facebook-scales-ai/
Chapter 4 Figure 48: FB Learner. Source: https://www.zdnet.com/article/how-facebook-scales-ai/

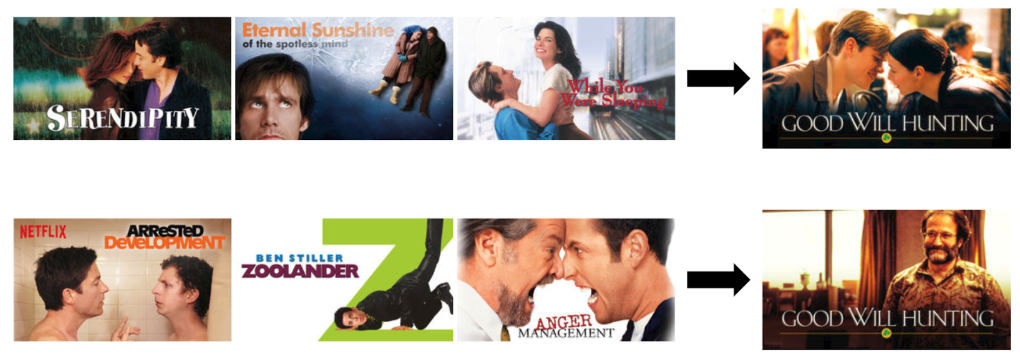
 Chapter 4 Figure 49: Three prior movie choices influence the personalised tile displayed for Good Fill Hunting. Source: Netflix

Chapter 4 Figure 49: Three prior movie choices influence the personalised tile displayed for Good Fill Hunting. Source: Netflix

 Chapter 4 Figure 50: Machine Learning Applications. Source: HBR/Andrew Ng https://hbr.org/2016/11/what-artificial-intelligence-can-and-cant-do-right-now
Chapter 4 Figure 50: Machine Learning Applications. Source: HBR/Andrew Ng https://hbr.org/2016/11/what-artificial-intelligence-can-and-cant-do-right-now

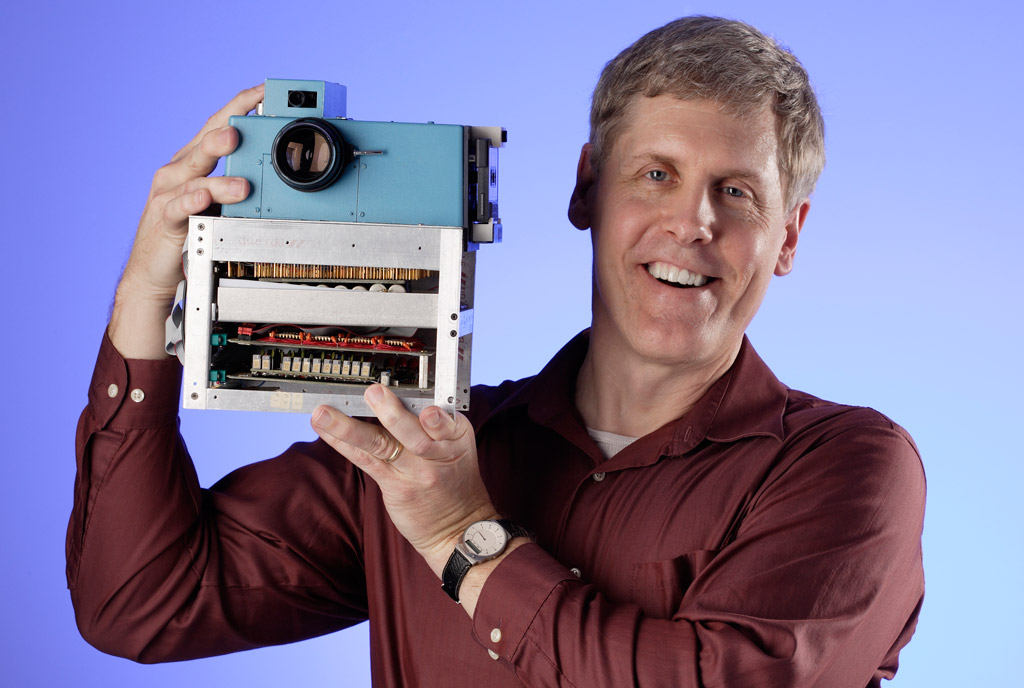
 Chapter 5 Figure 51: Steve Sasson of Kodak and the first digital camera. Source: http://www.internethistorypodcast.com/2016/07/inventor-of-the-first-digital-camera-steven-sasson/

Chapter 5 Figure 51: Steve Sasson of Kodak and the first digital camera. Source: http://www.internethistorypodcast.com/2016/07/inventor-of-the-first-digital-camera-steven-sasson/

 Chapter 5 Figure 52: Kodak’s Digital Photo display unit.

Chapter 5 Figure 52: Kodak’s Digital Photo display unit.

 Chapter 5 Figure 53: Very few camera sensors end up in ‘cameras’. Source Andreessen Horowitz

Chapter 5 Figure 53: Very few camera sensors end up in ‘cameras’. Source Andreessen Horowitz

 Chapter 5 Figure 54: The tumbling cost of camera sensors. Source: http://itac.ca/uploads/events/execforum2010/rob_lineback_10-6-10-2.ppt

Chapter 5 Figure 54: The tumbling cost of camera sensors. Source: http://itac.ca/uploads/events/execforum2010/rob_lineback_10-6-10-2.ppt

 Chapter 5 Figure 55: The Digital Takeover. Source: PMA

Chapter 5 Figure 55: The Digital Takeover. Source: PMA

 Chapter 5 Figure 56: Two Pizzas on a Stove. Source: Google

Chapter 5 Figure 56: Two Pizzas on a Stove. Source: Google

 Chapter 5 Figure 57: ML-derived improvements in Object Detection. Source: AIIndex.org

Chapter 5 Figure 57: ML-derived improvements in Object Detection. Source: AIIndex.org

 Chapter 5 Figure 58: Google Cloud Vision API services. Source: Google

Chapter 5 Figure 58: Google Cloud Vision API services. Source: Google

 Chapter 5 Figure 59: Google Video Intelligence service recognises a Tiger in a view. Source: Google - https://cloud.google.com/video-intelligence/

Chapter 5 Figure 59: Google Video Intelligence service recognises a Tiger in a view. Source: Google - https://cloud.google.com/video-intelligence/

 Chapter 5 Figure 60: Google Lens (L) and Pinterest Visual Search (R). Source: Google/Pinterest

Chapter 5 Figure 60: Google Lens (L) and Pinterest Visual Search (R). Source: Google/Pinterest

 Chapter 5 Figure 61: A future bathroom mirror watching us. Source: The Next Web

Chapter 5 Figure 61: A future bathroom mirror watching us. Source: The Next Web

 Chapter 5 Figure 62: Google’s Sentiment Analysis API. Source: Google

Chapter 5 Figure 62: Google’s Sentiment Analysis API. Source: Google

 Chapter 5 Figure 63: The Terminator - a science fiction movie presentation of Scanning and Object Recognition from 1991 now possible

Chapter 5 Figure 63: The Terminator - a science fiction movie presentation of Scanning and Object Recognition from 1991 now possible

 Chapter 5 Figure 64: Microsoft’s Seeing AI App. Source: Microsoft
Chapter 5 Figure 64: Microsoft’s Seeing AI App. Source: Microsoft

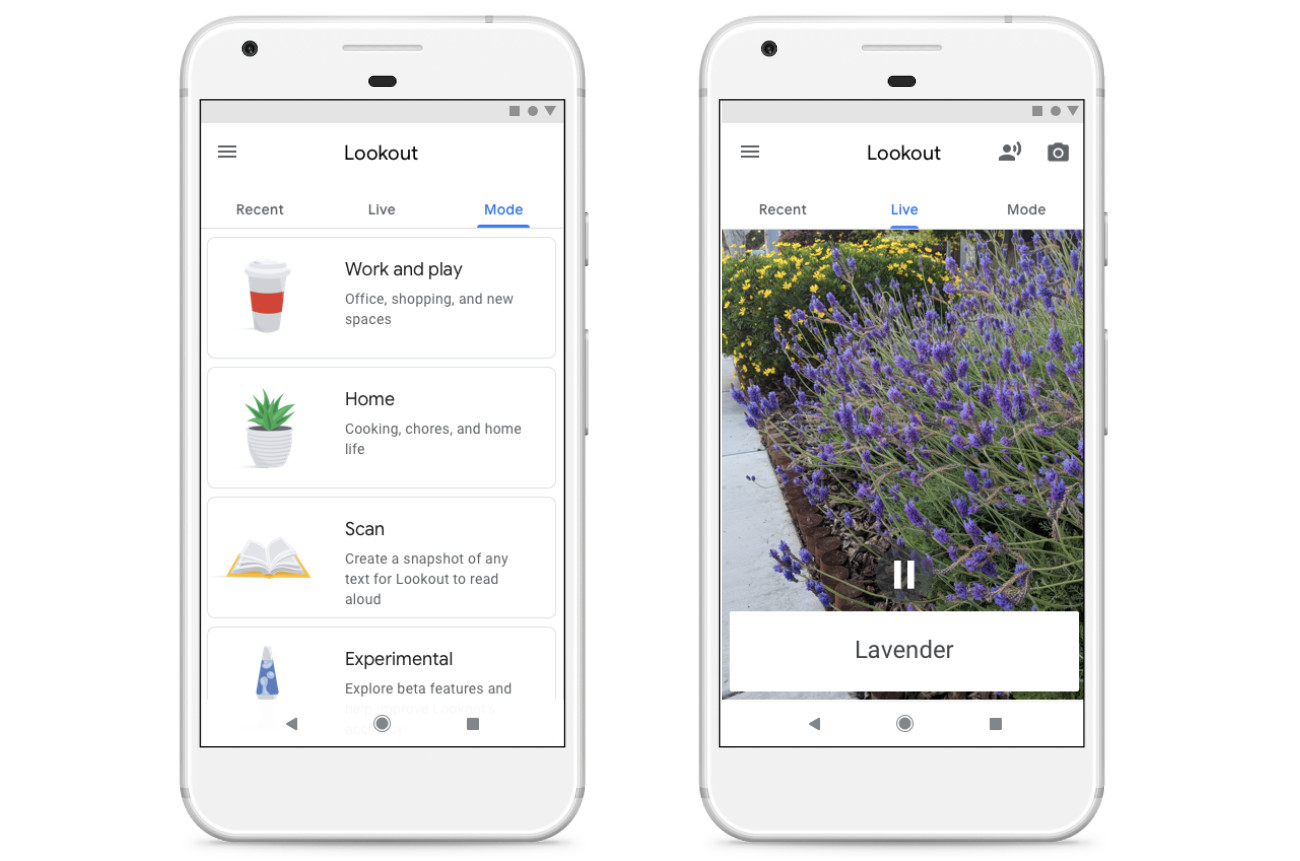
 Chapter 5 Figure 65: Google’s Lookout App. Source: Google

Chapter 5 Figure 65: Google’s Lookout App. Source: Google

 Chapter 5 Figure 66: Computer Vision Lip Reading. Source https://arxiv.org/pdf/1611.05358.pdf

Chapter 5 Figure 66: Computer Vision Lip Reading. Source https://arxiv.org/pdf/1611.05358.pdf

 Chapter 5 Figure 67: Google’s Object Removal Technology (Unreleased). Source: Google IO 2017

Chapter 5 Figure 67: Google’s Object Removal Technology (Unreleased). Source: Google IO 2017

 Chapter 5 Figure 68: ML removes raindrops from image. Source: https://arxiv.org/abs/1711.10098

Chapter 5 Figure 68: ML removes raindrops from image. Source: https://arxiv.org/abs/1711.10098

 Chapter 5 Figure 69: Raindrop removal improves object detection scores. Source: https://arxiv.org/abs/1711.10098

Chapter 5 Figure 69: Raindrop removal improves object detection scores. Source: https://arxiv.org/abs/1711.10098

 Chapter 5 Figure 70: Snow AR App Beauty Effects. Source: Snow AR

Chapter 5 Figure 70: Snow AR App Beauty Effects. Source: Snow AR

 Chapter 5 Figure 71: Google Clips Smart Camera powered by AI

Chapter 5 Figure 71: Google Clips Smart Camera powered by AI

 Chapter 5 Figure 72: The Growing CCTV market. Source IHS

Chapter 5 Figure 72: The Growing CCTV market. Source IHS

 Chapter 5 Figure 73: Police Officer in China wearing AI-powered smart glasses. Source: AFP/Getty Images.

Chapter 5 Figure 73: Police Officer in China wearing AI-powered smart glasses. Source: AFP/Getty Images.

 Chapter 5 Figure 74: Amazon’s Rekognition Product Overview. Source: Amazon

Chapter 5 Figure 74: Amazon’s Rekognition Product Overview. Source: Amazon

 Chapter 5 Figure 75: Amazon’s Rekognition can pick out multiple faces in a crowd photo. Source: Amazon

Chapter 5 Figure 75: Amazon’s Rekognition can pick out multiple faces in a crowd photo. Source: Amazon

 Chapter 5 Figure 76: Growth in the Dashcam market. Source: TMR Analysis

Chapter 5 Figure 76: Growth in the Dashcam market. Source: TMR Analysis

 Chapter 5 Figure 77: A Panasonic sensor can see through Soy Sauce. Source: Panasonic

Chapter 5 Figure 77: A Panasonic sensor can see through Soy Sauce. Source: Panasonic

 Chapter 5 Figure 78: A Sony Camera view vs what’s visible by ambient light. Source: Sony

Chapter 5 Figure 78: A Sony Camera view vs what’s visible by ambient light. Source: Sony

 Chapter 6 Figure 79: The 6 stages of voice computing
Chapter 6 Figure 79: The 6 stages of voice computing

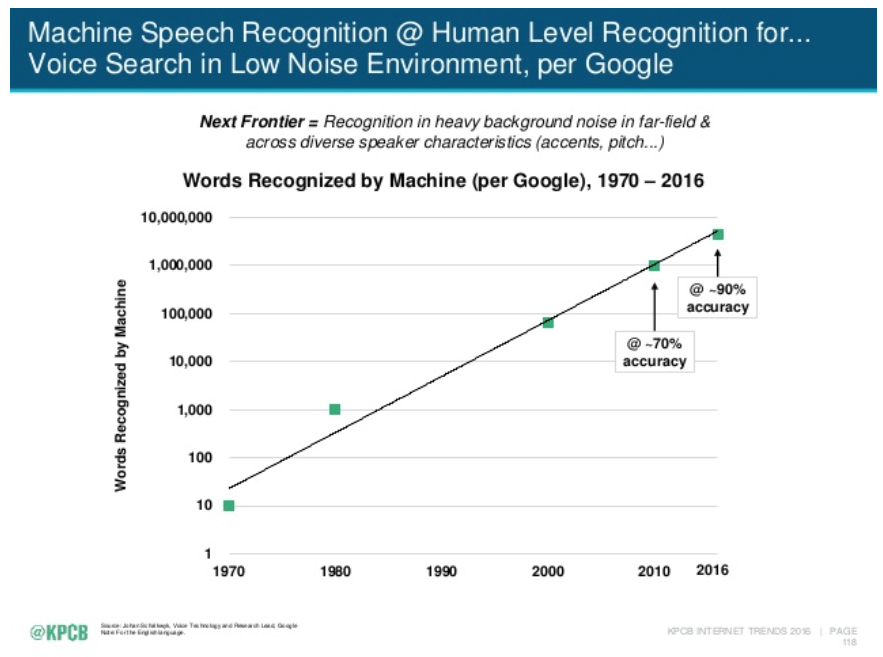
 Chapter 6 Figure 80: Word Recognition over the years. Source: https://www.kleinerperkins.com/perspectives/internet-trends-report-2018

Chapter 6 Figure 80: Word Recognition over the years. Source: https://www.kleinerperkins.com/perspectives/internet-trends-report-2018

 Chapter 6 Figure 81: Speech Recognition Word Error Rate improvements. Source: Google

Chapter 6 Figure 81: Speech Recognition Word Error Rate improvements. Source: Google

 Chapter 6 Figure 82: Visual Weather Forecast. Source: Google

Chapter 6 Figure 82: Visual Weather Forecast. Source: Google

 Chapter 6 Figure 83: Voice Assistants are being adopted rapidly. Source: The Economist
Chapter 6 Figure 83: Voice Assistants are being adopted rapidly. Source: The Economist

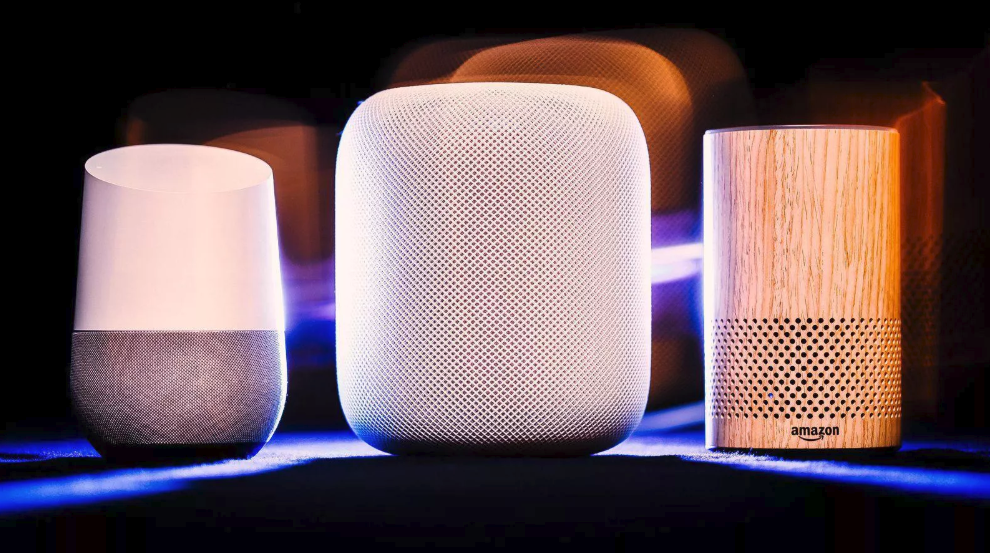
 Chapter 6 Figure 84: L-R: Google Home, Apple HomePod and Amazon Echo voice-enabled speakers.

Chapter 6 Figure 84: L-R: Google Home, Apple HomePod and Amazon Echo voice-enabled speakers.

 Chapter 6 Figure 85: Location of Smart Speakers in the Home. Source: https://www.thinkwithgoogle.com/consumer-insights/voice-assistance-consumer-experience/

Chapter 6 Figure 85: Location of Smart Speakers in the Home. Source: https://www.thinkwithgoogle.com/consumer-insights/voice-assistance-consumer-experience/

 Chapter 6 Figure 86: Frequency of Smart Speaker usage. Source: https://voicebot.ai/wp-content/uploads/2018/03/smart_speaker_consumer_adoption_report_2018.pdf

Chapter 6 Figure 86: Frequency of Smart Speaker usage. Source: https://voicebot.ai/wp-content/uploads/2018/03/smart_speaker_consumer_adoption_report_2018.pdf

 Chapter 6 Figure 87: Google Duplex. Source: Google
Chapter 6 Figure 87: Google Duplex. Source: Google

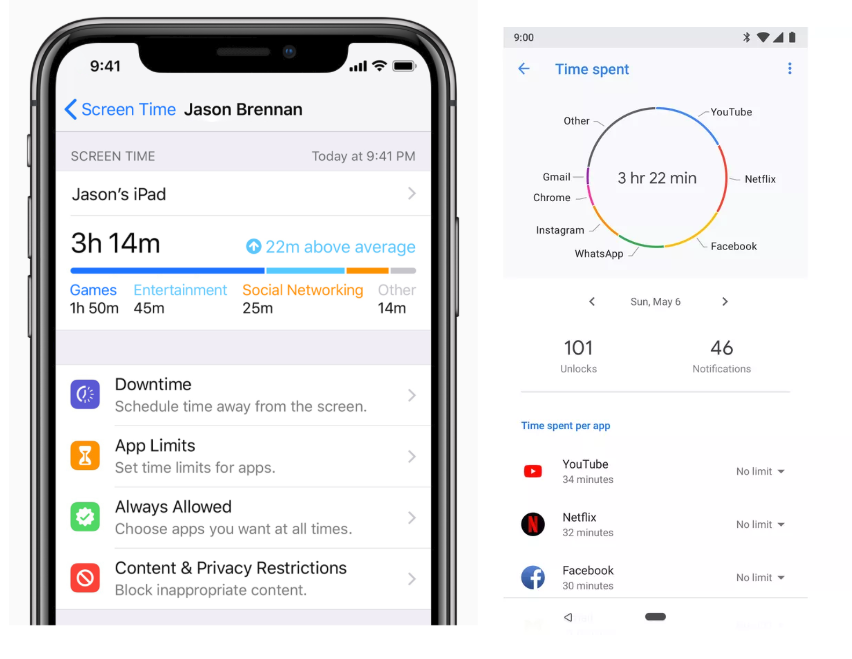
 Chapter 6 Figure 88: iOS (L) and Android (R) features to reduce usage. Source: Apple/Google

Chapter 6 Figure 88: iOS (L) and Android (R) features to reduce usage. Source: Apple/Google

 Chapter 6 Figure 89: Usage of Smart Speakers. Source: Reuters

Chapter 6 Figure 89: Usage of Smart Speakers. Source: Reuters

 Chapter 7 Figure 90: US Store Closures 2000-2017. Source: FT

Chapter 7 Figure 90: US Store Closures 2000-2017. Source: FT

 Chapter 7 Figure 91: Online as % of retail sales. Source: FT

Chapter 7 Figure 91: Online as % of retail sales. Source: FT

 Chapter 7 Figure 92: Shopify adds AI features. Source: Shopify

Chapter 7 Figure 92: Shopify adds AI features. Source: Shopify

 Chapter 7 Figure 93: More stores move online. Source: https://www.kleinerperkins.com/perspectives/internet-trends-report-2018

Chapter 7 Figure 93: More stores move online. Source: https://www.kleinerperkins.com/perspectives/internet-trends-report-2018

 Chapter 7 Figure 94: Social Shopping on Instagram (L) and Pinterest (R). Source: Instagram/Pinterest

Chapter 7 Figure 94: Social Shopping on Instagram (L) and Pinterest (R). Source: Instagram/Pinterest

 Chapter 7 Figure 95: Social Media and Shopping. Source: https://www.kleinerperkins.com/perspectives/internet-trends-report-2018

Chapter 7 Figure 95: Social Media and Shopping. Source: https://www.kleinerperkins.com/perspectives/internet-trends-report-2018

 Chapter 7: Figure 96: Physical Dash Button (L) and Virtual Dash Button on mobile (R). Source: Amazon

Chapter 7: Figure 96: Physical Dash Button (L) and Virtual Dash Button on mobile (R). Source: Amazon

 Chapter 7 Figure 97: Example of a printer with automated replenishment built-in via DRS. Source: Amazon

Chapter 7 Figure 97: Example of a printer with automated replenishment built-in via DRS. Source: Amazon

 Chapter 7 Figure 98: Amazon Dash Wand (L) and Subscription Service (R). Source: Amazon

Chapter 7 Figure 98: Amazon Dash Wand (L) and Subscription Service (R). Source: Amazon

 Chapter 7 Figure 99: Voice Shopping. Source: https://www.kleinerperkins.com/perspectives/internet-trends-report-2018

Chapter 7 Figure 99: Voice Shopping. Source: https://www.kleinerperkins.com/perspectives/internet-trends-report-2018

 Chapter 7 Figure 100: User attitudes to voice shopping. Source: Google

Chapter 7 Figure 100: User attitudes to voice shopping. Source: Google

 Chapter 7 Figure 101: Scan with your phone to checkout with Grab+Go from Barclaycard. Source; Barclaycard

Chapter 7 Figure 101: Scan with your phone to checkout with Grab+Go from Barclaycard. Source; Barclaycard

 Chapter 7 Figure 102: Amazon Go Checkout-less store. Source: Amazon

Chapter 7 Figure 102: Amazon Go Checkout-less store. Source: Amazon

 Chapter 7 Figure 103: A Stitch Fix user profile. Source; Stitch Fix

Chapter 7 Figure 103: A Stitch Fix user profile. Source; Stitch Fix

 Chapter 7 Figure 104: Amazon Prime Wardrobe user experience. Source: Amazon

Chapter 7 Figure 104: Amazon Prime Wardrobe user experience. Source: Amazon

 Chapter 7 Figure 105: Credit Card imprint machine (L) and Swipe/Chip/Contactless terminal (R)

Chapter 7 Figure 105: Credit Card imprint machine (L) and Swipe/Chip/Contactless terminal (R)

 Chapter 7 Figure 106: Dine and Dash table top terminal. Source: Barclaycard

Chapter 7 Figure 106: Dine and Dash table top terminal. Source: Barclaycard

 Chapter 7 Figure 7: The Growth of Subscriptions. Source: https://www.kleinerperkins.com/perspectives/internet-trends-report-2018

Chapter 7 Figure 7: The Growth of Subscriptions. Source: https://www.kleinerperkins.com/perspectives/internet-trends-report-2018

 Chapter 7 Figure 108: Containers speed up logistics. Source: CSCL

Chapter 7 Figure 108: Containers speed up logistics. Source: CSCL

 Chapter 7 Figure 109: Ocado Warehouse Robots. Source: Ocado
Chapter 7 Figure 109: Ocado Warehouse Robots. Source: Ocado

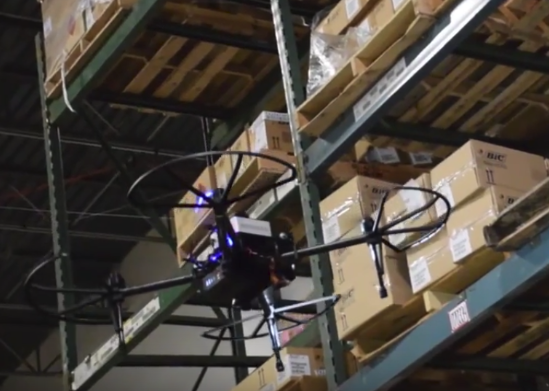
 Chapter 7 Figure 110: Inventory Scanning Drone.

Chapter 7 Figure 110: Inventory Scanning Drone.

 Chapter 7 Figure 111: A BossaNova stock-taking robot. Source: BossaNova

Chapter 7 Figure 111: A BossaNova stock-taking robot. Source: BossaNova

 Chapter 7 Figure 112: The Growth of Parcel Volumes. Source: https://www.kleinerperkins.com/perspectives/internet-trends-report-2018

Chapter 7 Figure 112: The Growth of Parcel Volumes. Source: https://www.kleinerperkins.com/perspectives/internet-trends-report-2018

 Chapter 7 Figure 113: What Consumers consider “Fast” Shipping. Source: Deloitte via Business Insider

Chapter 7 Figure 113: What Consumers consider “Fast” Shipping. Source: Deloitte via Business Insider

 Chapter 7 Figure 114: Speed vs Price of Delivery. Source: McKinsey

Chapter 7 Figure 114: Speed vs Price of Delivery. Source: McKinsey

 Chapter 7 Figure 115: Last Mile Delivery. Source: McKinsey

Chapter 7 Figure 115: Last Mile Delivery. Source: McKinsey

 Chapter 7 Figure 116: Amazon Prime Air and Amazon Flex. Source: Amazon.

Chapter 7 Figure 116: Amazon Prime Air and Amazon Flex. Source: Amazon.

 Chapter 7 Figure 117: Circular nature of commerce and logistics. Source: Accenture

Chapter 7 Figure 117: Circular nature of commerce and logistics. Source: Accenture

 Chapter 7 Figure 118: Willingness to pay for faster delivery.

Chapter 7 Figure 118: Willingness to pay for faster delivery.

 Chapter 7 Figure 119: Amazon Lockers (top), Amazon Key Home Delivery (L) and Amazon Key Car Delivery (R). Source: Amazon

Chapter 7 Figure 119: Amazon Lockers (top), Amazon Key Home Delivery (L) and Amazon Key Car Delivery (R). Source: Amazon

 Chapter 7 Figure 120: Amazon Pickup (L) and Walmart Pickup (R). Source: Amazon/Walmart

Chapter 7 Figure 120: Amazon Pickup (L) and Walmart Pickup (R). Source: Amazon/Walmart

 Chapter 7 Figure 121: Starship Robots sidewalk delivery (L) and Nuro Autonomous delivery vehicle (R)

Chapter 7 Figure 121: Starship Robots sidewalk delivery (L) and Nuro Autonomous delivery vehicle (R)

 Chapter 7 Figure 122: Wing (Top-L), Amazon Prime Air (Top-R) and Zipline (Bottom) delivery drones.

Chapter 7 Figure 122: Wing (Top-L), Amazon Prime Air (Top-R) and Zipline (Bottom) delivery drones.

 Chapter 8 Figure 123: Tell Google Sheets what chart to draw without knowing any commands. Source: Google

Chapter 8 Figure 123: Tell Google Sheets what chart to draw without knowing any commands. Source: Google

 Chapter 8 Figure 124: X.ai and Voicera

Chapter 8 Figure 124: X.ai and Voicera

 Chapter 8 Figure 125: The Washington Post’s Heliograf can write stories based on data inputs. Source: The Washington Post.

Chapter 8 Figure 125: The Washington Post’s Heliograf can write stories based on data inputs. Source: The Washington Post.

 Chapter 8 Figure 126: Intelligent Surveillance Cameras (L) may bring the Panopticon concept to fruition.

Chapter 8 Figure 126: Intelligent Surveillance Cameras (L) may bring the Panopticon concept to fruition.

 Chapter 8 Figure 127: Google’s Cancer Detection with Deep Learning. Source: Google

Chapter 8 Figure 127: Google’s Cancer Detection with Deep Learning. Source: Google

 Chapter 8 Figure 128: Deep Learning outperforms baseline methods in hospital records. Source: Google.

Chapter 8 Figure 128: Deep Learning outperforms baseline methods in hospital records. Source: Google.

 Chapter 8 Figure 129: ML-powered app checks a Cassava Leaf for Disease. Source: Nuru PlantVillage.

Chapter 8 Figure 129: ML-powered app checks a Cassava Leaf for Disease. Source: Nuru PlantVillage.

 Chapter 8 Figure 130: ML-powered robot by Root.ai can identify and pick ripe fruit. Source: Root.ai

Chapter 8 Figure 130: ML-powered robot by Root.ai can identify and pick ripe fruit. Source: Root.ai

 Chapter 8 Figure 131: Robots in Amazon Fulfilment Centres.

Chapter 8 Figure 131: Robots in Amazon Fulfilment Centres.

 Chapter 8 Figure 132: Industrial Robots in operation. Source: State of AI 2018 Report

Chapter 8 Figure 132: Industrial Robots in operation. Source: State of AI 2018 Report

 Chapter 8 Figure 133: Industrial Robots by Country. Source: State of AI 2018 Report

Chapter 8 Figure 133: Industrial Robots by Country. Source: State of AI 2018 Report

 Chapter 8 Figure 134: McKinsey Automation Risk Interactive Tool. Source: http://www.visualcapitalist.com/charting-automation-potential-of-u-s-jobs/

Chapter 8 Figure 134: McKinsey Automation Risk Interactive Tool. Source: http://www.visualcapitalist.com/charting-automation-potential-of-u-s-jobs/

 Chapter 8 Figure 135 Flippy the Burger Robot and Zume the Pizza Robot

Chapter 8 Figure 135 Flippy the Burger Robot and Zume the Pizza Robot

 Chapter 9 Figure 137: Public Awareness of AI use. Source: the RSA

Chapter 9 Figure 137: Public Awareness of AI use. Source: the RSA

 Chapter 9 Figure 138: DeepMind Ethics & Society and Partnership on AI

Chapter 9 Figure 138: DeepMind Ethics & Society and Partnership on AI

 Chapter 9 Figure 139: DARPA Initiatives on Explainable AI. Source: DARPA

Chapter 9 Figure 139: DARPA Initiatives on Explainable AI. Source: DARPA

 Chapter 9 Figure 139: DARPA Initiatives on Explainable AI. Source: DARPA

Chapter 9 Figure 139: DARPA Initiatives on Explainable AI. Source: DARPA

 Chapter 9 Figure 141: R&D Spending by US Companies in 2017

Chapter 9 Figure 141: R&D Spending by US Companies in 2017

 Chapter 9 Figure 142: AI acquisitions by the tech giants. Source: CB Insights

Chapter 9 Figure 142: AI acquisitions by the tech giants. Source: CB Insights

 Chapter 9 Figure 143: The Intelligent Classroom. Source: Business Insider

Chapter 9 Figure 143: The Intelligent Classroom. Source: Business Insider

 Chapter 9 Figure 144: Facebook’s DensePose

Chapter 9 Figure 144: Facebook’s DensePose

 Chapter 9 Figure 145: Drone detection of violent behaviour in crowds. Source: Univ of Cambridge

Chapter 9 Figure 145: Drone detection of violent behaviour in crowds. Source: Univ of Cambridge

 Chapter 9 Figure 146: Microsoft’s Cognitive Services APIs. Source: Microsoft

Chapter 9 Figure 146: Microsoft’s Cognitive Services APIs. Source: Microsoft

 Chapter 10 Figure 147: Do you want your regular? Source: Google

Chapter 10 Figure 147: Do you want your regular? Source: Google

 Chapter 10 Figure 148: The Experts are Divided. Source: Futurism.com

Chapter 10 Figure 148: The Experts are Divided. Source: Futurism.com

1 2 3 4 5 6 7 8 9 10 11 12 13 14 15 16 17 18 19 20 21 22 23 24 25 26 27 28 29 30 31 32 33 34 35 36 37 38 39 40 41 42 43 44 45 46 47 48 49 50 51 52 53 54 55 56 57 58 59 60 61 62 63 64 65 66 67 68 69 70 71 72 73 74 75 76 77 78 79 80 81 82 83 84 85 86 87 88 89 90 91 92 93 94 95 96 97 98 99 100 101 102 103 104 105 106 107 108 109 110 111 112 113 114 115 116 117 118 119 120 121 122 123 124 125 126 127 128 129 130 131 132 133 134 135 136 137 138 139 140 141 142 143 144 145 146
Previous Next
 Chapter 1 Figure 1: Very Bad Predictions. Source: http://infographic.city/timeline-bad-future-predictions/
 Chapter 2 Figure 2: We now expect free instant access to any information. Source: http://officialshoebox.tumblr.com/post/165805010726/hbd-google-thanks-for-giving-us-access-to-all-of
 Chapter 2 Figure 3: 2018 Gartner Hype Cycle for Emerging Technologies. Source: https://www.gartner.com/en/newsroom/press-releases/2018-08-20-gartner-identifies-five-emerging-technology-trends-that-will-blur-the-lines-between-human-and-machine
 Chapter 2 Figure 4: The Adoption Curve. Source: http://weblog.tetradian.com/2016/08/09/tech-adoption-tech-evolution-lifecycle-mgmt/
 Chapter 2 Figure 5: Years to widespread adoption. Source: @mikequindazzi
 Chapter 2 Figure 6: The S-Curve. Source: http://robotwatch.co/s-curves-comparative-advantage
 Chapter 2 Figure 7: The S Curve. Source: Andreessen Horotwitz
 Chapter 2 Figure 8: Blackberry Sales. Source: Andreessen Horotwitz
 Chapter 3 Figure 9: International Soccer game on Commodore 64, 1983
 Chapter 3 Figure 10: FIFA 2017 Soccer game by EA, 2017
 Chapter 3 Figure 11: The Evolution of Tomb Raider Graphics 1996 to 2014 thanks to improved processing speeds. Source: https://www.halloweencostumes.com/blog/p-468-tomb-raider-infographic.aspx
 Chapter 3 Figure 12: Fixed Line Connectivity Speed Improvements. Source: http://www.woltercomputers.com/blog/2014/06/10/bandwidth-comparison-chart
 Chapter 3 Figure 13: Internet Seconds in 2018. Source: https://www.allaccess.com/merge/archive/28030/2018-update-what-happens-in-an-internet-minute#sthash.IKyiTou1.uxfs
 Chapter 3 Figure 14: Declining Price of Personal Computers. Source: Bloomberg via https://twitter.com/ValaAfshar
 Chapter 3 Figure 15: Data Connections between Chicago and New York. Source: https://www.zerohedge.com/news/chicago-new-york-and-back-85-milliseconds
 Chapter 3 Figure 16: An Apple A11 CPU in an iPhone (contains 4.3 billion transistors). Source: Best Mobile Destination
 Chapter 3 Figure 17: GPU Performance. Source: Nvidia
 Chapter 3 Figure 18: An Nvidia GPU for a desktop PC - with 12 billion transistors. Source: Nvidia
 Chapter 3 Figure 19: A Microsoft Executive holding an FPGA board. Source: Microsoft
 Chapter 3 Figure 20: A Google TPU. Source: Google
 Chapter 3 Figure 21: A Google Edge TPU. Source Google
 Chapter 3 Figure 22: The Summit Supercomputer. Source: Carlos Jones, Oak Ridge National Laboratory/U.S. Dept. of Energy
 Chapter 3 Figure 23: A Google Bristlecone Quantum chip. Source: Google
 Chapter 3 Figure 24: 1956 IBM Model 350 hard disk with 4Mb storage capacity. Source: http://historydaily.org/the-worlds-first-computer-with-data-storage
 Chapter 3 Figure 25: A 1.44Mb floppy disk and a Micro SD card which can be upto 512Gb.
 Chapter 3 Figure 26: Average web page size (in KB). Source https://speedcurve.com/blog/web-performance-page-bloat/
 Chapter 3 Figure 27: Wi-Fi Speeds. Source https://10techy.com/802-11ac-or-802-11n/
 Chapter 3 Figure 28: Cellular Connectivity Speeds. Source: http://nimbuzz.com/us/article/technology/5g-yay-or-nay-227
 Chapter 3 Figure 29: Genome Sequencing Costs over time. Source genome.gov/sequencingcostsdata
 Chapter 3 Figure 31: Uber speeds up a decades-old process. Source:  https://www.slideshare.net/schlaf/on-demand-everything
 Chapter 3 Figure 32: Pace Layers. Source: https://www.pinterest.ie/pin/266838346645832089/
 Chapter 4 Figure 33: Publication of AI Papers. Source: https://aiindex.org/2017-report.pdf
 Chapter 4 Figure 34: Publication of AI Papers. Source: https://aiindex.org/2017-report.pdf
 Chapter 4 Figure 35: The emergence of AI, ML and DL. Source: https://medium.com/mmc-writes/the-fourth-industrial-revolution-a-primer-on-artificial-intelligence-ai-ff5e7fffcae1
 Chapter 4 Figure 36: Typical Machine Learning Flow
 Chapter 4 Figure 37: Layers in a (simplified) Neural Network Source: https://medium.com/mmc-writes/the-fourth-industrial-revolution-a-primer-on-artificial-intelligence-ai-ff5e7fffcae1
 Chapter 4 Figure 38: Training and Inference. Source: Nvidia
 Chapter 4 Figure 39 GPUs driving speed improvements in Training Speeds. Source: Nvidia
 Chapter 4 Figure 40: A model that took 6 days in 2010 can run in 18 minutes now. Source: https://www.slideshare.net/nb410/the-state-of-artificial-intelligence-in-2018-a-good-old-fashioned-report-103568798
 Chapter 4 Figure 41: Global Internet Data Traffic - note logarithmic scale. Source: https://medium.com/mmc-writes/the-fourth-industrial-revolution-a-primer-on-artificial-intelligence-ai-ff5e7fffcae1
 Chapter 4 Figure 42: Data Creation Rate in Zettabytes. Source: https://www.kleinerperkins.com/perspectives/internet-trends-report-2018
 Chapter 4 Figure 43: Popular AI Frameworks available for free download. Source: https://www.slideshare.net/jiangjun1990/gdgshanghai-2017-tensorflow-summit-recap
 Chapter 4 Figure 44: Deep Learning’s impact on Image Recognition Tests. Source: https://medium.com/mmc-writes/the-fourth-industrial-revolution-a-primer-on-artificial-intelligence-ai-ff5e7fffcae1
 Chapter 4 Figure 45: Deep Learning’s impact on Speech Recognition Tests. Source: https://medium.com/mmc-writes/the-fourth-industrial-revolution-a-primer-on-artificial-intelligence-ai-ff5e7fffcae1
 Chapter 4 Figure 46: ML Use in Google. Source: Google Cloud
 Chapter 4 Figure 47: AlphaGo in action. Source: DeepMind
 Chapter 4 Figure 48: FB Learner. Source:  https://www.zdnet.com/article/how-facebook-scales-ai/
 Chapter 4 Figure 49: Three prior movie choices influence the personalised tile displayed for Good Fill Hunting. Source: Netflix
 Chapter 4 Figure 50: Machine Learning Applications. Source: HBR/Andrew Ng https://hbr.org/2016/11/what-artificial-intelligence-can-and-cant-do-right-now
 Chapter 5 Figure 51: Steve Sasson of Kodak and the first digital camera. Source: http://www.internethistorypodcast.com/2016/07/inventor-of-the-first-digital-camera-steven-sasson/
 Chapter 5 Figure 52: Kodak’s Digital Photo display unit.
 Chapter 5 Figure 53: Very few camera sensors end up in ‘cameras’. Source Andreessen Horowitz
 Chapter 5 Figure 54: The tumbling cost of camera sensors. Source: http://itac.ca/uploads/events/execforum2010/rob_lineback_10-6-10-2.ppt
 Chapter 5 Figure 55: The Digital Takeover. Source: PMA
 Chapter 5 Figure 56: Two Pizzas on a Stove. Source: Google
 Chapter 5 Figure 57: ML-derived improvements in Object Detection. Source: AIIndex.org
 Chapter 5 Figure 58: Google Cloud Vision API services. Source: Google
 Chapter 5 Figure 59: Google Video Intelligence service recognises a Tiger in a view. Source: Google - https://cloud.google.com/video-intelligence/
 Chapter 5 Figure 60: Google Lens (L) and Pinterest Visual Search (R). Source: Google/Pinterest
 Chapter 5 Figure 61: A future bathroom mirror watching us. Source: The Next Web
 Chapter 5 Figure 62: Google’s Sentiment Analysis API. Source: Google
 Chapter 5 Figure 63: The Terminator - a science fiction movie presentation of Scanning and Object Recognition from 1991 now possible
 Chapter 5 Figure 64: Microsoft’s Seeing AI App. Source: Microsoft
 Chapter 5 Figure 65: Google’s Lookout App. Source: Google
 Chapter 5 Figure 66: Computer Vision Lip Reading. Source https://arxiv.org/pdf/1611.05358.pdf
 Chapter 5 Figure 67: Google’s Object Removal Technology (Unreleased). Source: Google IO 2017
 Chapter 5 Figure 68: ML removes raindrops from image. Source: https://arxiv.org/abs/1711.10098
 Chapter 5 Figure 69: Raindrop removal improves object detection scores. Source: https://arxiv.org/abs/1711.10098
 Chapter 5 Figure 70: Snow AR App Beauty Effects. Source: Snow AR
 Chapter 5 Figure 71: Google Clips Smart Camera powered by AI
 Chapter 5 Figure 72: The Growing CCTV market. Source IHS
 Chapter 5 Figure 73: Police Officer in China wearing AI-powered smart glasses. Source: AFP/Getty Images.
 Chapter 5 Figure 74: Amazon’s Rekognition Product Overview. Source: Amazon
 Chapter 5 Figure 75: Amazon’s Rekognition can pick out multiple faces in a crowd photo. Source: Amazon
 Chapter 5 Figure 76: Growth in the Dashcam market. Source: TMR Analysis
 Chapter 5 Figure 77: A Panasonic sensor can see through Soy Sauce. Source: Panasonic
 Chapter 5 Figure 78: A Sony Camera view vs what’s visible by ambient light. Source: Sony
 Chapter 6 Figure 79: The 6 stages of voice computing
 Chapter 6 Figure 80: Word Recognition over the years. Source: https://www.kleinerperkins.com/perspectives/internet-trends-report-2018
 Chapter 6 Figure 81: Speech Recognition Word Error Rate improvements. Source: Google
 Chapter 6 Figure 82: Visual Weather Forecast. Source: Google
 Chapter 6 Figure 83: Voice Assistants are being adopted rapidly. Source: The Economist
 Chapter 6 Figure 84: L-R: Google Home, Apple HomePod and Amazon Echo voice-enabled speakers.
 Chapter 6 Figure 85: Location of Smart Speakers in the Home. Source: https://www.thinkwithgoogle.com/consumer-insights/voice-assistance-consumer-experience/
 Chapter 6 Figure 86: Frequency of Smart Speaker usage. Source: https://voicebot.ai/wp-content/uploads/2018/03/smart_speaker_consumer_adoption_report_2018.pdf
 Chapter 6 Figure 87: Google Duplex. Source: Google
 Chapter 6 Figure 88: iOS (L) and Android (R) features to reduce usage. Source: Apple/Google
 Chapter 6 Figure 89: Usage of Smart Speakers. Source: Reuters
 Chapter 7 Figure 90: US Store Closures 2000-2017. Source: FT
 Chapter 7 Figure 91: Online as % of retail sales. Source: FT
 Chapter 7 Figure 92: Shopify adds AI features. Source: Shopify
 Chapter 7 Figure 93: More stores move online. Source: https://www.kleinerperkins.com/perspectives/internet-trends-report-2018
 Chapter 7 Figure 94: Social Shopping on Instagram (L) and Pinterest (R). Source: Instagram/Pinterest
 Chapter 7 Figure 95: Social Media and Shopping. Source: https://www.kleinerperkins.com/perspectives/internet-trends-report-2018
 Chapter 7: Figure 96: Physical Dash Button (L) and Virtual Dash Button on mobile (R). Source: Amazon
 Chapter 7 Figure 97: Example of a printer with automated replenishment built-in via DRS. Source: Amazon
 Chapter 7 Figure 98: Amazon Dash Wand (L) and Subscription Service (R). Source: Amazon
 Chapter 7 Figure 99: Voice Shopping. Source: https://www.kleinerperkins.com/perspectives/internet-trends-report-2018
 Chapter 7 Figure 100: User attitudes to voice shopping. Source: Google
 Chapter 7 Figure 101: Scan with your phone to checkout with Grab+Go from Barclaycard. Source; Barclaycard
 Chapter 7 Figure 102: Amazon Go Checkout-less store. Source: Amazon
 Chapter 7 Figure 103: A Stitch Fix user profile. Source; Stitch Fix
 Chapter 7 Figure 104: Amazon Prime Wardrobe user experience. Source: Amazon
 Chapter 7 Figure 105: Credit Card imprint machine (L) and Swipe/Chip/Contactless terminal (R)
 Chapter 7 Figure 106: Dine and Dash table top terminal. Source: Barclaycard
 Chapter 7 Figure 7: The Growth of Subscriptions. Source: https://www.kleinerperkins.com/perspectives/internet-trends-report-2018
 Chapter 7 Figure 108: Containers speed up logistics. Source: CSCL
 Chapter 7 Figure 109: Ocado Warehouse Robots. Source: Ocado
 Chapter 7 Figure 110: Inventory Scanning Drone.
 Chapter 7 Figure 111: A BossaNova stock-taking robot. Source: BossaNova
 Chapter 7 Figure 112: The Growth of Parcel Volumes. Source: https://www.kleinerperkins.com/perspectives/internet-trends-report-2018
 Chapter 7 Figure 113: What Consumers consider “Fast” Shipping. Source: Deloitte via Business Insider
 Chapter 7 Figure 114: Speed vs Price of Delivery. Source: McKinsey
 Chapter 7 Figure 115: Last Mile Delivery. Source: McKinsey
 Chapter 7 Figure 116: Amazon Prime Air and Amazon Flex. Source: Amazon.
 Chapter 7 Figure 117: Circular nature of commerce and logistics. Source: Accenture
 Chapter 7 Figure 118: Willingness to pay for faster delivery.
 Chapter 7 Figure 119: Amazon Lockers (top), Amazon Key Home Delivery (L) and Amazon Key Car Delivery (R). Source: Amazon
 Chapter 7 Figure 120: Amazon Pickup (L) and Walmart Pickup (R). Source: Amazon/Walmart
 Chapter 7 Figure 121: Starship Robots sidewalk delivery (L) and Nuro Autonomous delivery vehicle (R)
 Chapter 7 Figure 122: Wing (Top-L), Amazon Prime Air (Top-R) and Zipline (Bottom) delivery drones.
 Chapter 8 Figure 123: Tell Google Sheets what chart to draw without knowing any commands. Source: Google
 Chapter 8 Figure 124: X.ai and Voicera
 Chapter 8 Figure 125: The Washington Post’s Heliograf can write stories based on data inputs. Source: The Washington Post.
 Chapter 8 Figure 126: Intelligent Surveillance Cameras (L) may bring the Panopticon concept to fruition.
 Chapter 8 Figure 127: Google’s Cancer Detection with Deep Learning. Source: Google
 Chapter 8 Figure 128: Deep Learning outperforms baseline methods in hospital records. Source: Google.
 Chapter 8 Figure 129: ML-powered app checks a Cassava Leaf for Disease. Source: Nuru PlantVillage.
 Chapter 8 Figure 130: ML-powered robot by Root.ai can identify and pick ripe fruit. Source: Root.ai
 Chapter 8 Figure 131: Robots in Amazon Fulfilment Centres.
 Chapter 8 Figure 132: Industrial Robots in operation. Source: State of AI 2018 Report
 Chapter 8 Figure 133: Industrial Robots by Country. Source: State of AI 2018 Report
 Chapter 8 Figure 134: McKinsey Automation Risk Interactive Tool. Source: http://www.visualcapitalist.com/charting-automation-potential-of-u-s-jobs/
 Chapter 8 Figure 135 Flippy the Burger Robot and Zume the Pizza Robot
 Chapter 9 Figure 137: Public Awareness of AI use. Source: the RSA
 Chapter 9 Figure 138: DeepMind Ethics & Society and Partnership on AI
 Chapter 9 Figure 139: DARPA Initiatives on Explainable AI. Source: DARPA
 Chapter 9 Figure 139: DARPA Initiatives on Explainable AI. Source: DARPA
 Chapter 9 Figure 141: R&D Spending by US Companies in 2017
 Chapter 9 Figure 142: AI acquisitions by the tech giants. Source: CB Insights
 Chapter 9 Figure 143: The Intelligent Classroom. Source: Business Insider
 Chapter 9 Figure 144: Facebook’s DensePose
 Chapter 9 Figure 145: Drone detection of violent behaviour in crowds. Source: Univ of Cambridge
 Chapter 9 Figure 146: Microsoft’s Cognitive Services APIs. Source: Microsoft
 Chapter 10 Figure 147: Do you want your regular? Source: Google
 Chapter 10 Figure 148: The Experts are Divided. Source: Futurism.com

David Kerrigan Author Page on Amazon

Back to Top

Copyright David Kerrigan 2015-2025